Copyright © 2015-2017 Standard Performance Evaluation Corporation
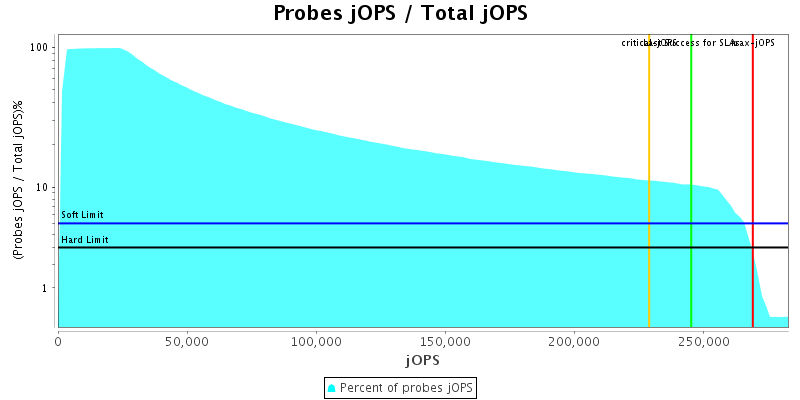
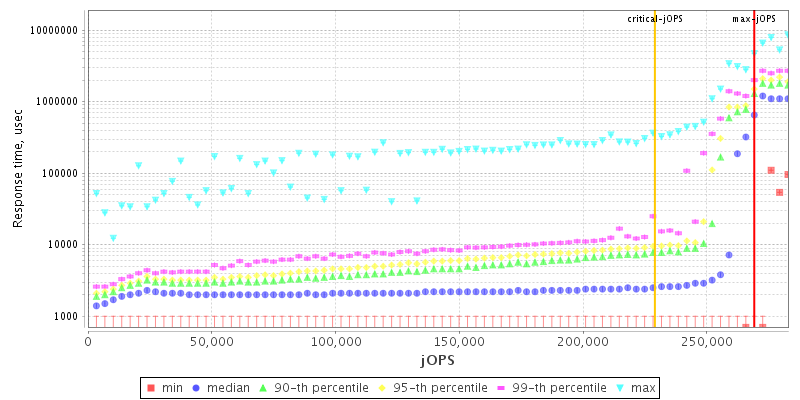
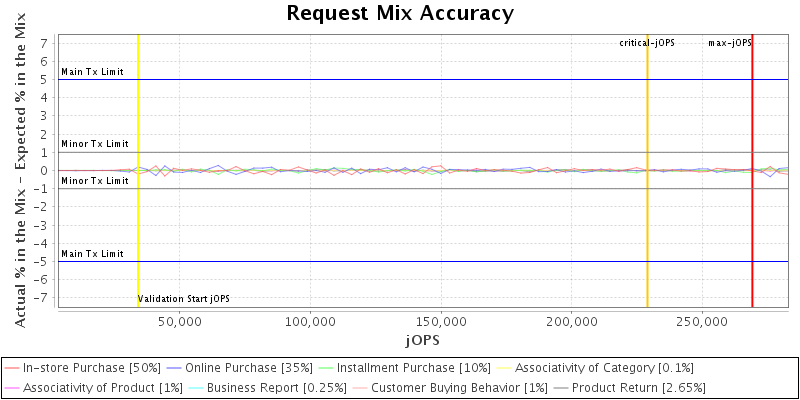
| H3C H3C UniServer R6900 G3 | 269094 SPECjbb2015-MultiJVM max-jOPS 228957 SPECjbb2015-MultiJVM critical-jOPS |
||
| Tested by: H3C | Test Sponsor: H3C | Test location: Hangzhou, ZheJiang, China | Test date: Aug 30, 2017 |
| SPEC license #: 9066 | Hardware Availability: Oct-2017 | Software Availability: Jul-2017 | Publication: Thu Sep 28 17:00:08 EDT 2017 |
|
SPECjbb2015-MultiJVM: Multiple JVMs/Single Host
(# of groups: 4) |
 |
|
|
|
||||||||||||||||||||||||||||||||||||||||||||||||||||||||||||
|
|
|||||||||||||||||||||||||||||||||||||||||||||||||||||||||||||||||||||||||||||||||||||||||||||||||||||||||||||||||||||||||||||||||||||||||
 |
|
| This section lists properties only set by user | |||||||||||||||||||||||||||||||||||||||||||||
| |||||||||||||||||||||||||||||||||||||||||||||
| View table in csv format |
| Level: COMPLIANCE | ||
| Check | Agent | Result |
| Check properties on compliance | All | PASSED |
| Level: CORRECTNESS | ||
| Check | Agent | Result |
| Compare SM and HQ Inventory | All | PASSED |