SPECpower_ssj2008
Host '0001' Performance Report
Copyright © 2007-2008 Standard Performance Evaluation Corporation
| ASUSTeK Computer Inc. ASUS RS160-E5 (Intel Xeon L5430 Processor, 2.66 GHz) | ssj_ops@100% = 278,927 ssj_ops@100% per JVM = 69,732 |
||||
| Test Sponsor: | ASUSTeK Company Inc. | SPEC License #: | 9016 | Test Method: | Single Node |
| Tested By: | ASUSTeK Company Inc. | Test Location: | Taipei, Taiwan R.O.C. | Test Date: | Oct 27, 2008 |
| Hardware Availability: | Oct-2008 | Software Availability: | Sep-2008 | Publication: | Nov 20, 2008 |
| System Source: | Single Supplier | System Designation: | Server | Power Provisioning: | Line-powered |
| Target Load | Actual Load | ssj_ops | |
|---|---|---|---|
| Target | Actual | ||
| Calibration 1 | 278,963 | ||
| Calibration 2 | 281,706 | ||
| Calibration 3 | 280,708 | ||
| ssj_ops@calibrated=281,207 | |||
| 100% | 99.2% | 281,207 | 278,927 |
| 90% | 89.7% | 253,086 | 252,327 |
| 80% | 80.4% | 224,965 | 226,095 |
| 70% | 70.0% | 196,845 | 196,907 |
| 60% | 59.8% | 168,724 | 168,211 |
| 50% | 49.9% | 140,603 | 140,335 |
| 40% | 40.1% | 112,483 | 112,784 |
| 30% | 30.1% | 84,362 | 84,723 |
| 20% | 20.1% | 56,241 | 56,512 |
| 10% | 10.0% | 28,121 | 28,193 |
| Active Idle | 0 | 0 | |

| Set Identifier: | sut |
| Set Description: | ASUS RS160-E5 (Intel Xeon L5430 Processor, 2.66 GHz) |
| # of Identical Nodes: | 1 |
| Comment: | None |
| Hardware | |
|---|---|
| Hardware Vendor: | ASUSTeK Computer Inc. |
| Model: | ASUS RS160-E5 (Intel Xeon L5430 Processor, 2.66 GHz) |
| Form Factor: | -- |
| CPU Name: | Intel Xeon L5430 |
| CPU Characteristics: | 2.66 GHz, 2 x 6MB L2 Cache, 1333 MHz System Bus |
| CPU Frequency (MHz): | 2666 |
| CPU(s) Enabled: | 8 cores, 2 chips, 4 cores/chip |
| Hardware Threads: | 8 (1 / core) |
| CPU(s) Orderable: | 1,2 chips |
| Primary Cache: | 32 KB I + 32 KB D on chip per core |
| Secondary Cache: | 12 MB I+D on chip per chip, 6 MB shared / 2 cores |
| Tertiary Cache: | None |
| Other Cache: | None |
| Memory Amount (GB): | 8 |
| # and size of DIMM: | 2 x 4096 MB |
| Memory Details: | DDR2-667 CL5 DIMM; Slots A1 and B1 are populated |
| Power Supply Quantity and Rating (W): | 1 x 460 |
| Power Supply Details: | FSP FSP460-701UG |
| Disk Drive: | 1 x Hitachi (3.5", SATA, 80 GB, 7.2K RPM) |
| Disk Controller: | Integrated ICH-9R SATA controller |
| # and type of Network Interface Cards (NICs) Installed: | 2 x Broadcom BCM5721 Gigabit Ethernet controllers (onboard) |
| NICs Enabled in Firmware / OS / Connected: | 2/2/1 |
| Network Speed (Mbit): | 1000 |
| Keyboard: | KVM |
| Mouse: | KVM |
| Monitor: | KVM |
| Optical Drives: | Yes |
| Other Hardware: | None |
| Software | |
|---|---|
| Power Management: | Enabled (Server Balanced Power and Performance) |
| Operating System (OS): | Windows Server 2003 R2, Enterprise x64 Edition |
| OS Version: | Service Pack 2 Build 3790 |
| Filesystem: | NTFS |
| JVM Vendor: | Oracle Corporation |
| JVM Version: | BEA JRockit(R) (build R27.5.0-110_CR366951-97327-1.5.0_14-20080408-1708-windows-x86_64, compiled mode) |
| JVM Command-line Options: | -Xms1700m -Xns1300m -Xmx1700m -XXaggressive -XXthroughputcompaction -XXlazyunlocking -XXcallprofiling -Xgc:genpar -XXgcthreads=2 -XXtlasize:min=4k,preferred=512k |
| JVM Affinity: | start /affinity [0x3,0xc,0x30,0xc0] |
| JVM Instances: | 8 |
| JVM Initial Heap (MB): | 1700 |
| JVM Maximum Heap (MB): | 1700 |
| JVM Address Bits: | 64 |
| Boot Firmware Version: | -- |
| Management Firmware Version: | -- |
| Workload Version: | SSJ 1.1.3 |
| Director Location: | Controller |
| Other Software: | None |
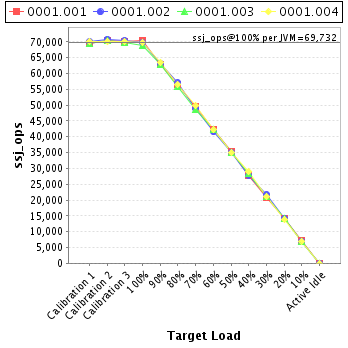
| JVM Instance | ssj_ops@100% |
|---|---|
| 0001.001 | 70,438 |
| 0001.002 | 69,719 |
| 0001.003 | 68,937 |
| 0001.004 | 69,834 |
| ssj_ops@100% | 278,927 |
| ssj_ops@100% per JVM | 69,732 |
| Target Load | Actual Load | ssj_ops | |
|---|---|---|---|
| Target | Actual | ||
| Calibration 1 | 69,394 | ||
| Calibration 2 | 70,398 | ||
| Calibration 3 | 70,172 | ||
| ssj_ops@calibrated=70,285 | |||
| 100% | 100.2% | 70,285 | 70,438 |
| 90% | 89.5% | 63,256 | 62,927 |
| 80% | 80.4% | 56,228 | 56,485 |
| 70% | 70.3% | 49,199 | 49,417 |
| 60% | 60.3% | 42,171 | 42,347 |
| 50% | 50.3% | 35,142 | 35,321 |
| 40% | 39.3% | 28,114 | 27,655 |
| 30% | 29.7% | 21,085 | 20,854 |
| 20% | 20.4% | 14,057 | 14,304 |
| 10% | 10.2% | 7,028 | 7,201 |
| Active Idle | 0 | 0 | |
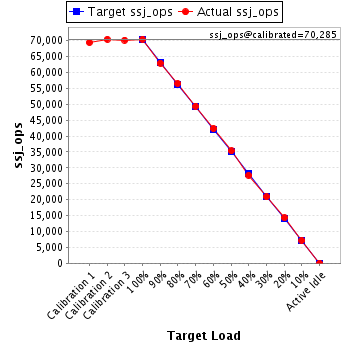
| Target Load | Actual Load | ssj_ops | |
|---|---|---|---|
| Target | Actual | ||
| Calibration 1 | 69,978 | ||
| Calibration 2 | 70,854 | ||
| Calibration 3 | 70,422 | ||
| ssj_ops@calibrated=70,638 | |||
| 100% | 98.7% | 70,638 | 69,719 |
| 90% | 89.3% | 63,574 | 63,060 |
| 80% | 80.7% | 56,510 | 57,027 |
| 70% | 69.5% | 49,447 | 49,072 |
| 60% | 58.8% | 42,383 | 41,526 |
| 50% | 49.6% | 35,319 | 35,055 |
| 40% | 39.5% | 28,255 | 27,905 |
| 30% | 30.7% | 21,191 | 21,700 |
| 20% | 20.2% | 14,128 | 14,248 |
| 10% | 9.9% | 7,064 | 7,004 |
| Active Idle | 0 | 0 | |

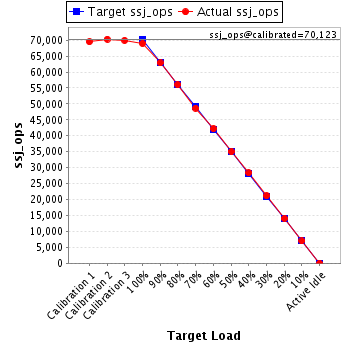
| Target Load | Actual Load | ssj_ops | |
|---|---|---|---|
| Target | Actual | ||
| Calibration 1 | 69,477 | ||
| Calibration 2 | 70,307 | ||
| Calibration 3 | 69,939 | ||
| ssj_ops@calibrated=70,123 | |||
| 100% | 98.3% | 70,123 | 68,937 |
| 90% | 89.6% | 63,111 | 62,855 |
| 80% | 79.9% | 56,099 | 55,999 |
| 70% | 69.4% | 49,086 | 48,685 |
| 60% | 60.2% | 42,074 | 42,194 |
| 50% | 49.9% | 35,062 | 35,014 |
| 40% | 40.4% | 28,049 | 28,323 |
| 30% | 30.1% | 21,037 | 21,133 |
| 20% | 20.1% | 14,025 | 14,068 |
| 10% | 10.0% | 7,012 | 7,000 |
| Active Idle | 0 | 0 | |
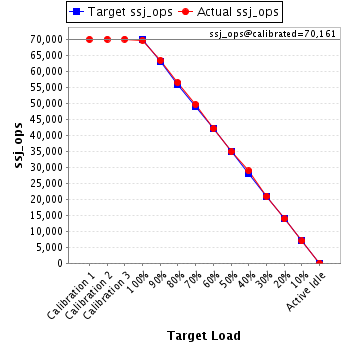
| Target Load | Actual Load | ssj_ops | |
|---|---|---|---|
| Target | Actual | ||
| Calibration 1 | 70,114 | ||
| Calibration 2 | 70,146 | ||
| Calibration 3 | 70,175 | ||
| ssj_ops@calibrated=70,161 | |||
| 100% | 99.5% | 70,161 | 69,834 |
| 90% | 90.5% | 63,144 | 63,485 |
| 80% | 80.7% | 56,128 | 56,585 |
| 70% | 70.9% | 49,112 | 49,733 |
| 60% | 60.1% | 42,096 | 42,143 |
| 50% | 49.8% | 35,080 | 34,945 |
| 40% | 41.2% | 28,064 | 28,901 |
| 30% | 30.0% | 21,048 | 21,037 |
| 20% | 19.8% | 14,032 | 13,891 |
| 10% | 10.0% | 7,016 | 6,987 |
| Active Idle | 0 | 0 | |