SPECpower_ssj2008
Host '0001' Performance Report
Copyright © 2007-2008 Standard Performance Evaluation Corporation
| ASUSTeK Computer Inc. ASUS RS160-E5 (Intel Xeon L5420 Processor, 2.50 GHz) | ssj_ops@100% = 270,621 ssj_ops@100% per JVM = 67,655 |
||||
| Test Sponsor: | ASUSTeK Company Inc. | SPEC License #: | 9016 | Test Method: | Single Node |
| Tested By: | ASUSTeK Company Inc. | Test Location: | Taipei, Taiwan R.O.C. | Test Date: | Oct 30, 2008 |
| Hardware Availability: | Oct-2008 | Software Availability: | Sep-2008 | Publication: | Nov 20, 2008 |
| System Source: | Single Supplier | System Designation: | Server | Power Provisioning: | Line-powered |
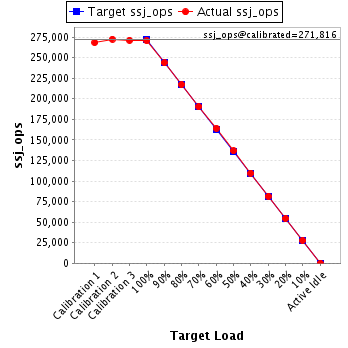
| Target Load | Actual Load | ssj_ops | |
|---|---|---|---|
| Target | Actual | ||
| Calibration 1 | 268,273 | ||
| Calibration 2 | 272,487 | ||
| Calibration 3 | 271,145 | ||
| ssj_ops@calibrated=271,816 | |||
| 100% | 99.6% | 271,816 | 270,621 |
| 90% | 89.7% | 244,635 | 243,781 |
| 80% | 79.9% | 217,453 | 217,287 |
| 70% | 70.0% | 190,271 | 190,374 |
| 60% | 60.4% | 163,090 | 164,101 |
| 50% | 50.3% | 135,908 | 136,642 |
| 40% | 40.4% | 108,726 | 109,715 |
| 30% | 30.0% | 81,545 | 81,424 |
| 20% | 20.1% | 54,363 | 54,513 |
| 10% | 10.2% | 27,182 | 27,828 |
| Active Idle | 0 | 0 | |
| Set Identifier: | sut |
| Set Description: | ASUS RS160-E5 (Intel Xeon L5420 Processor, 2.50 GHz) |
| # of Identical Nodes: | 1 |
| Comment: | None |
| Hardware | |
|---|---|
| Hardware Vendor: | ASUSTeK Computer Inc. |
| Model: | ASUS RS160-E5 (Intel Xeon L5420 Processor, 2.50 GHz) |
| Form Factor: | -- |
| CPU Name: | Intel Xeon L5420 |
| CPU Characteristics: | 2.50 GHz, 2 x 6MB L2 Cache, 1333 MHz System Bus |
| CPU Frequency (MHz): | 2500 |
| CPU(s) Enabled: | 8 cores, 2 chips, 4 cores/chip |
| Hardware Threads: | 8 (1 / core) |
| CPU(s) Orderable: | 1,2 chips |
| Primary Cache: | 32 KB I + 32 KB D on chip per core |
| Secondary Cache: | 12 MB I+D on chip per chip, 6 MB shared / 2 cores |
| Tertiary Cache: | None |
| Other Cache: | None |
| Memory Amount (GB): | 8 |
| # and size of DIMM: | 2 x 4096 MB |
| Memory Details: | DDR2-667 CL5 DIMM; Slots A1 and B1 are populated |
| Power Supply Quantity and Rating (W): | 1 x 460 |
| Power Supply Details: | FSP FSP460-701UG |
| Disk Drive: | 1 x Hitachi (3.5", SATA, 80 GB, 7.2K RPM) |
| Disk Controller: | Integrated ICH-9R SATA controller |
| # and type of Network Interface Cards (NICs) Installed: | 2 x Broadcom BCM5721 Gigabit Ethernet controllers (onboard) |
| NICs Enabled in Firmware / OS / Connected: | 2/2/1 |
| Network Speed (Mbit): | 1000 |
| Keyboard: | KVM |
| Mouse: | KVM |
| Monitor: | KVM |
| Optical Drives: | Yes |
| Other Hardware: | None |
| Software | |
|---|---|
| Power Management: | Enabled (Server Balanced Power and Performance) |
| Operating System (OS): | Windows Server 2003 R2, Enterprise x64 Edition |
| OS Version: | Service Pack 2 Build 3790 |
| Filesystem: | NTFS |
| JVM Vendor: | Oracle Corporation |
| JVM Version: | BEA JRockit(R) (build R27.5.0-110_CR366951-97327-1.5.0_14-20080408-1708-windows-x86_64, compiled mode) |
| JVM Command-line Options: | -Xms1700m -Xns1300m -Xmx1700m -XXaggressive -XXthroughputcompaction -XXlazyunlocking -XXcallprofiling -Xgc:genpar -XXgcthreads=2 -XXtlasize:min=4k,preferred=512k |
| JVM Affinity: | start /affinity [0x3,0xc,0x30,0xc0] |
| JVM Instances: | 8 |
| JVM Initial Heap (MB): | 1700 |
| JVM Maximum Heap (MB): | 1700 |
| JVM Address Bits: | 64 |
| Boot Firmware Version: | -- |
| Management Firmware Version: | -- |
| Workload Version: | SSJ 1.1.3 |
| Director Location: | Controller |
| Other Software: | None |
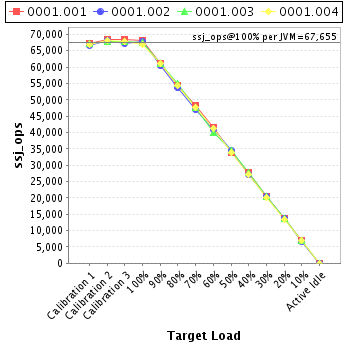
| JVM Instance | ssj_ops@100% |
|---|---|
| 0001.001 | 68,017 |
| 0001.002 | 67,935 |
| 0001.003 | 67,644 |
| 0001.004 | 67,025 |
| ssj_ops@100% | 270,621 |
| ssj_ops@100% per JVM | 67,655 |
| Target Load | Actual Load | ssj_ops | |
|---|---|---|---|
| Target | Actual | ||
| Calibration 1 | 67,274 | ||
| Calibration 2 | 68,558 | ||
| Calibration 3 | 68,330 | ||
| ssj_ops@calibrated=68,444 | |||
| 100% | 99.4% | 68,444 | 68,017 |
| 90% | 89.3% | 61,600 | 61,110 |
| 80% | 79.4% | 54,755 | 54,315 |
| 70% | 70.4% | 47,911 | 48,182 |
| 60% | 60.7% | 41,066 | 41,557 |
| 50% | 49.6% | 34,222 | 33,954 |
| 40% | 40.6% | 27,378 | 27,786 |
| 30% | 29.8% | 20,533 | 20,374 |
| 20% | 19.8% | 13,689 | 13,583 |
| 10% | 10.2% | 6,844 | 6,966 |
| Active Idle | 0 | 0 | |

| Target Load | Actual Load | ssj_ops | |
|---|---|---|---|
| Target | Actual | ||
| Calibration 1 | 66,683 | ||
| Calibration 2 | 68,069 | ||
| Calibration 3 | 67,233 | ||
| ssj_ops@calibrated=67,651 | |||
| 100% | 100.4% | 67,651 | 67,935 |
| 90% | 89.4% | 60,886 | 60,478 |
| 80% | 79.4% | 54,121 | 53,693 |
| 70% | 69.5% | 47,356 | 47,006 |
| 60% | 60.7% | 40,590 | 41,062 |
| 50% | 50.9% | 33,825 | 34,415 |
| 40% | 40.0% | 27,060 | 27,055 |
| 30% | 30.3% | 20,295 | 20,490 |
| 20% | 20.3% | 13,530 | 13,737 |
| 10% | 10.0% | 6,765 | 6,791 |
| Active Idle | 0 | 0 | |

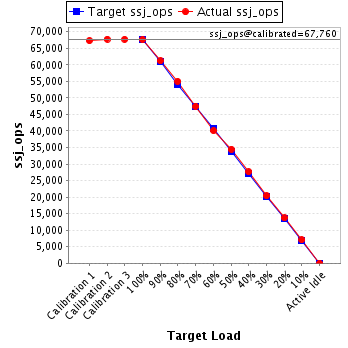
| Target Load | Actual Load | ssj_ops | |
|---|---|---|---|
| Target | Actual | ||
| Calibration 1 | 67,294 | ||
| Calibration 2 | 67,767 | ||
| Calibration 3 | 67,754 | ||
| ssj_ops@calibrated=67,760 | |||
| 100% | 99.8% | 67,760 | 67,644 |
| 90% | 90.3% | 60,984 | 61,195 |
| 80% | 81.2% | 54,208 | 55,012 |
| 70% | 70.1% | 47,432 | 47,502 |
| 60% | 59.2% | 40,656 | 40,118 |
| 50% | 50.9% | 33,880 | 34,491 |
| 40% | 40.8% | 27,104 | 27,653 |
| 30% | 30.1% | 20,328 | 20,391 |
| 20% | 20.2% | 13,552 | 13,695 |
| 10% | 10.5% | 6,776 | 7,093 |
| Active Idle | 0 | 0 | |
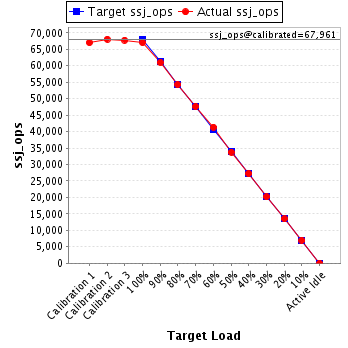
| Target Load | Actual Load | ssj_ops | |
|---|---|---|---|
| Target | Actual | ||
| Calibration 1 | 67,021 | ||
| Calibration 2 | 68,094 | ||
| Calibration 3 | 67,828 | ||
| ssj_ops@calibrated=67,961 | |||
| 100% | 98.6% | 67,961 | 67,025 |
| 90% | 89.8% | 61,165 | 60,998 |
| 80% | 79.8% | 54,369 | 54,266 |
| 70% | 70.2% | 47,573 | 47,684 |
| 60% | 60.9% | 40,777 | 41,364 |
| 50% | 49.7% | 33,981 | 33,782 |
| 40% | 40.1% | 27,184 | 27,221 |
| 30% | 29.7% | 20,388 | 20,169 |
| 20% | 19.9% | 13,592 | 13,499 |
| 10% | 10.3% | 6,796 | 6,977 |
| Active Idle | 0 | 0 | |