SPECpower_ssj2008
Host '0001' Performance Report
Copyright © 2007-2009 Standard Performance Evaluation Corporation
| Fujitsu PRIMERGY RX300 S4 (Intel Xeon L5430) | ssj_ops@100% = 325,849 ssj_ops@100% per JVM = 81,462 |
||||
| Test Sponsor: | Fujitsu | SPEC License #: | 19 | Test Method: | Single Node |
| Tested By: | Fujitsu Siemens Computers | Test Location: | Paderborn, NRW, Germany | Test Date: | 11.02.2009 |
| Hardware Availability: | Sep-2008 | Software Availability: | May-2009 | Publication: | Mar 11, 2009 |
| System Source: | Single Supplier | System Designation: | Server | Power Provisioning: | Line-powered |
| Target Load | Actual Load | ssj_ops | |
|---|---|---|---|
| Target | Actual | ||
| Calibration 1 | 331,671 | ||
| Calibration 2 | 327,982 | ||
| Calibration 3 | 327,916 | ||
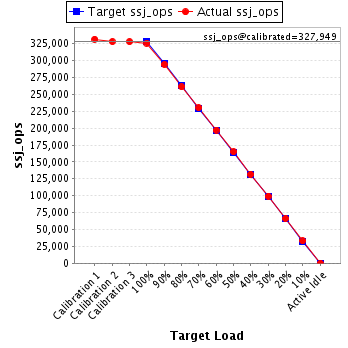
| ssj_ops@calibrated=327,949 | |||
| 100% | 99.4% | 327,949 | 325,849 |
| 90% | 89.7% | 295,154 | 294,182 |
| 80% | 79.6% | 262,359 | 261,106 |
| 70% | 70.2% | 229,564 | 230,176 |
| 60% | 60.1% | 196,769 | 197,203 |
| 50% | 50.2% | 163,975 | 164,779 |
| 40% | 40.1% | 131,180 | 131,605 |
| 30% | 30.3% | 98,385 | 99,309 |
| 20% | 20.2% | 65,590 | 66,196 |
| 10% | 10.1% | 32,795 | 33,022 |
| Active Idle | 0 | 0 | |
| Set Identifier: | sut |
| Set Description: | PRIMERGY RX300 S4 (Intel Xeon L5430) |
| # of Identical Nodes: | 1 |
| Comment: | None |
| Hardware | |
|---|---|
| Hardware Vendor: | Fujitsu |
| Model: | PRIMERGY RX300 S4 (Intel Xeon L5430) |
| Form Factor: | -- |
| CPU Name: | Intel Xeon L5430 |
| CPU Characteristics: | 2.66GHz, 2x6MB L2 cache, 1333MHz system bus |
| CPU Frequency (MHz): | 2667 |
| CPU(s) Enabled: | 8 cores, 2 chips, 4 cores/chip |
| Hardware Threads: | 8 (1 / core) |
| CPU(s) Orderable: | 1,2 chips |
| Primary Cache: | 32 KB I + 32 KB D on chip per core |
| Secondary Cache: | 12 MB I+D on chip per chip, 6 MB shared / 2 cores |
| Tertiary Cache: | None |
| Other Cache: | None |
| Memory Amount (GB): | 8 |
| # and size of DIMM: | 4 x 2048 MB |
| Memory Details: | 8GB 2Rx8 PC2-5300F ECC CL5; slots 1A, 1B, 1C, 1D populated |
| Power Supply Quantity and Rating (W): | 1 x 700 |
| Power Supply Details: | Delta Electronics, Inc DPS-700KB B |
| Disk Drive: | 1 x Seagate (3.5", SATA, 250GB, 7.2krpm) |
| Disk Controller: | LSI Logic Integrated SAS 3000 Series, 8-port with 1068E |
| # and type of Network Interface Cards (NICs) Installed: | 2 x Broadcom BCM5708C NetXtreme II GigE (onboard) |
| NICs Enabled in Firmware / OS / Connected: | 1/1/1 |
| Network Speed (Mbit): | 1000 |
| Keyboard: | KVM |
| Mouse: | KVM |
| Monitor: | KVM |
| Optical Drives: | No |
| Other Hardware: | None |
| Software | |
|---|---|
| Power Management: | Enabled ("Balanced" power scheme) |
| Operating System (OS): | Microsoft Windows Server 2008 Enterprise x64 Edition + SP2 |
| OS Version: | Version 6.0.6002 Service Pack 2, v.641 Build 6002 |
| Filesystem: | NTFS |
| JVM Vendor: | Oracle Corporation |
| JVM Version: | Oracle JRockit(R) 6 P28.0.0 (build P28.0.0-8-109238-1.6.0_05-20090130-1408-windows-x86_64) |
| JVM Command-line Options: | -Xms1700m -Xmx1700m -Xns1500m -XXaggressive -Xlargepages -Xgc:genpar -XXcallprofiling -XXgcthreads=2 -XXtlasize:min=4k,preferred=1024k -XXthroughputcompaction -XX:+UseStringCache |
| JVM Affinity: | start /affinity [0x03,0x30,0x0C,0xC0] |
| JVM Instances: | 8 |
| JVM Initial Heap (MB): | 1700 |
| JVM Maximum Heap (MB): | 1700 |
| JVM Address Bits: | 64 |
| Boot Firmware Version: | -- |
| Management Firmware Version: | -- |
| Workload Version: | SSJ 1.1.3 |
| Director Location: | Controller |
| Other Software: | None |
| JVM Instance | ssj_ops@100% |
|---|---|
| 0001.001 | 80,993 |
| 0001.002 | 81,390 |
| 0001.003 | 81,765 |
| 0001.004 | 81,700 |
| ssj_ops@100% | 325,849 |
| ssj_ops@100% per JVM | 81,462 |

| Target Load | Actual Load | ssj_ops | |
|---|---|---|---|
| Target | Actual | ||
| Calibration 1 | 82,560 | ||
| Calibration 2 | 82,117 | ||
| Calibration 3 | 82,167 | ||
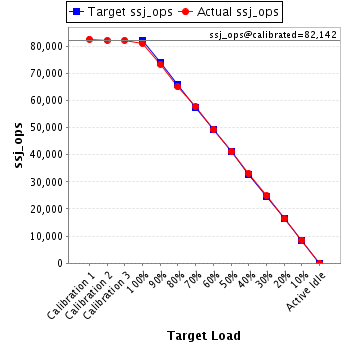
| ssj_ops@calibrated=82,142 | |||
| 100% | 98.6% | 82,142 | 80,993 |
| 90% | 89.2% | 73,928 | 73,306 |
| 80% | 79.1% | 65,714 | 64,965 |
| 70% | 70.3% | 57,499 | 57,710 |
| 60% | 59.9% | 49,285 | 49,240 |
| 50% | 50.0% | 41,071 | 41,067 |
| 40% | 40.2% | 32,857 | 33,015 |
| 30% | 30.2% | 24,643 | 24,803 |
| 20% | 20.0% | 16,428 | 16,419 |
| 10% | 10.4% | 8,214 | 8,537 |
| Active Idle | 0 | 0 | |
| Target Load | Actual Load | ssj_ops | |
|---|---|---|---|
| Target | Actual | ||
| Calibration 1 | 83,086 | ||
| Calibration 2 | 81,989 | ||
| Calibration 3 | 81,751 | ||
| ssj_ops@calibrated=81,870 | |||
| 100% | 99.4% | 81,870 | 81,390 |
| 90% | 90.5% | 73,683 | 74,107 |
| 80% | 80.3% | 65,496 | 65,714 |
| 70% | 70.5% | 57,309 | 57,697 |
| 60% | 60.0% | 49,122 | 49,156 |
| 50% | 50.8% | 40,935 | 41,614 |
| 40% | 39.5% | 32,748 | 32,366 |
| 30% | 30.1% | 24,561 | 24,612 |
| 20% | 20.2% | 16,374 | 16,515 |
| 10% | 9.8% | 8,187 | 8,033 |
| Active Idle | 0 | 0 | |

| Target Load | Actual Load | ssj_ops | |
|---|---|---|---|
| Target | Actual | ||
| Calibration 1 | 83,228 | ||
| Calibration 2 | 81,957 | ||
| Calibration 3 | 82,147 | ||
| ssj_ops@calibrated=82,052 | |||
| 100% | 99.7% | 82,052 | 81,765 |
| 90% | 89.1% | 73,847 | 73,069 |
| 80% | 79.3% | 65,642 | 65,045 |
| 70% | 70.0% | 57,436 | 57,399 |
| 60% | 59.4% | 49,231 | 48,721 |
| 50% | 50.3% | 41,026 | 41,288 |
| 40% | 40.2% | 32,821 | 32,971 |
| 30% | 30.1% | 24,616 | 24,664 |
| 20% | 20.2% | 16,410 | 16,546 |
| 10% | 10.0% | 8,205 | 8,181 |
| Active Idle | 0 | 0 | |

| Target Load | Actual Load | ssj_ops | |
|---|---|---|---|
| Target | Actual | ||
| Calibration 1 | 82,797 | ||
| Calibration 2 | 81,920 | ||
| Calibration 3 | 81,850 | ||
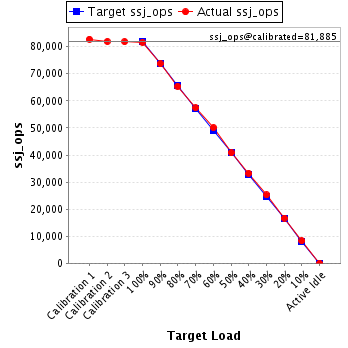
| ssj_ops@calibrated=81,885 | |||
| 100% | 99.8% | 81,885 | 81,700 |
| 90% | 90.0% | 73,696 | 73,700 |
| 80% | 79.8% | 65,508 | 65,381 |
| 70% | 70.1% | 57,319 | 57,370 |
| 60% | 61.2% | 49,131 | 50,085 |
| 50% | 49.8% | 40,942 | 40,810 |
| 40% | 40.6% | 32,754 | 33,253 |
| 30% | 30.8% | 24,565 | 25,230 |
| 20% | 20.4% | 16,377 | 16,716 |
| 10% | 10.1% | 8,188 | 8,271 |
| Active Idle | 0 | 0 | |