SPECpower_ssj2008
Host '0001' Performance Report
Copyright © 2007-2009 Standard Performance Evaluation Corporation
| Fujitsu Siemens Computers PRIMERGY RX300 S4 (Intel Xeon L5430) | ssj_ops@100% = 326,319 ssj_ops@100% per JVM = 81,580 |
||||
| Test Sponsor: | Fujitsu Siemens Computers | SPEC License #: | 22 | Test Method: | Single Node |
| Tested By: | Fujitsu Siemens Computers | Test Location: | Paderborn, NRW, Germany | Test Date: | 12.02.2009 |
| Hardware Availability: | Sep-2008 | Software Availability: | May-2009 | Publication: | Mar 11, 2009 |
| System Source: | Single Supplier | System Designation: | Server | Power Provisioning: | Line-powered |
| Target Load | Actual Load | ssj_ops | |
|---|---|---|---|
| Target | Actual | ||
| Calibration 1 | 331,610 | ||
| Calibration 2 | 327,707 | ||
| Calibration 3 | 327,725 | ||
| ssj_ops@calibrated=327,716 | |||
| 100% | 99.6% | 327,716 | 326,319 |
| 90% | 90.3% | 294,944 | 295,834 |
| 80% | 80.0% | 262,173 | 262,189 |
| 70% | 70.1% | 229,401 | 229,598 |
| 60% | 59.8% | 196,630 | 196,119 |
| 50% | 50.2% | 163,858 | 164,414 |
| 40% | 40.0% | 131,086 | 131,046 |
| 30% | 30.0% | 98,315 | 98,212 |
| 20% | 20.1% | 65,543 | 65,949 |
| 10% | 10.0% | 32,772 | 32,783 |
| Active Idle | 0 | 0 | |

| Set Identifier: | sut |
| Set Description: | PRIMERGY RX300 S4 (Intel Xeon L5430) |
| # of Identical Nodes: | 1 |
| Comment: | None |
| Hardware | |
|---|---|
| Hardware Vendor: | Fujitsu Siemens Computers |
| Model: | PRIMERGY RX300 S4 (Intel Xeon L5430) |
| Form Factor: | -- |
| CPU Name: | Intel Xeon L5430 |
| CPU Characteristics: | 2.66GHz, 2x6MB L2 cache, 1333MHz system bus |
| CPU Frequency (MHz): | 2667 |
| CPU(s) Enabled: | 8 cores, 2 chips, 4 cores/chip |
| Hardware Threads: | 8 (1 / core) |
| CPU(s) Orderable: | 1,2 chips |
| Primary Cache: | 32 KB I + 32 KB D on chip per core |
| Secondary Cache: | 12 MB I+D on chip per chip, 6 MB shared / 2 cores |
| Tertiary Cache: | None |
| Other Cache: | None |
| Memory Amount (GB): | 8 |
| # and size of DIMM: | 4 x 2048 MB |
| Memory Details: | 8GB 2Rx8 PC2-5300F ECC CL5; slots 1A, 1B, 1C, 1D populated |
| Power Supply Quantity and Rating (W): | 1 x 700 |
| Power Supply Details: | Delta Electronics, Inc DPS-700KB B |
| Disk Drive: | 1 x Seagate (3.5", SATA, 250GB, 7.2krpm) |
| Disk Controller: | LSI Logic Integrated SAS 3000 Series, 8-port with 1068E |
| # and type of Network Interface Cards (NICs) Installed: | 2 x Broadcom BCM5708C NetXtreme II GigE (onboard) |
| NICs Enabled in Firmware / OS / Connected: | 1/1/1 |
| Network Speed (Mbit): | 1000 |
| Keyboard: | KVM |
| Mouse: | KVM |
| Monitor: | KVM |
| Optical Drives: | No |
| Other Hardware: | None |
| Software | |
|---|---|
| Power Management: | Enabled ("Balanced" power scheme) |
| Operating System (OS): | Microsoft Windows Server 2008 Enterprise x64 Edition + SP2 |
| OS Version: | Version 6.0.6002 Service Pack 2, v.641 Build 6002 |
| Filesystem: | NTFS |
| JVM Vendor: | Oracle Corporation |
| JVM Version: | Oracle JRockit(R) 6 P28.0.0 (build P28.0.0-8-109238-1.6.0_05-20090130-1408-windows-x86_64) |
| JVM Command-line Options: | -Xms1700m -Xmx1700m -Xns1500m -XXaggressive -Xlargepages -Xgc:genpar -XXcallprofiling -XXgcthreads=2 -XXtlasize:min=4k,preferred=1024k -XXthroughputcompaction -XX:+UseStringCache |
| JVM Affinity: | start /affinity [0x03,0x30,0x0C,0xC0] |
| JVM Instances: | 8 |
| JVM Initial Heap (MB): | 1700 |
| JVM Maximum Heap (MB): | 1700 |
| JVM Address Bits: | 64 |
| Boot Firmware Version: | -- |
| Management Firmware Version: | -- |
| Workload Version: | SSJ 1.1.3 |
| Director Location: | Controller |
| Other Software: | None |
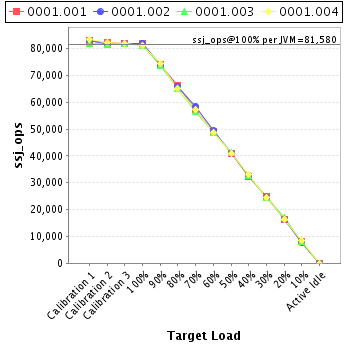
| JVM Instance | ssj_ops@100% |
|---|---|
| 0001.001 | 81,849 |
| 0001.002 | 82,097 |
| 0001.003 | 81,017 |
| 0001.004 | 81,355 |
| ssj_ops@100% | 326,319 |
| ssj_ops@100% per JVM | 81,580 |
| Target Load | Actual Load | ssj_ops | |
|---|---|---|---|
| Target | Actual | ||
| Calibration 1 | 82,930 | ||
| Calibration 2 | 82,223 | ||
| Calibration 3 | 82,068 | ||
| ssj_ops@calibrated=82,145 | |||
| 100% | 99.6% | 82,145 | 81,849 |
| 90% | 90.1% | 73,931 | 73,982 |
| 80% | 80.5% | 65,716 | 66,161 |
| 70% | 69.7% | 57,502 | 57,295 |
| 60% | 59.7% | 49,287 | 49,001 |
| 50% | 49.8% | 41,073 | 40,902 |
| 40% | 39.4% | 32,858 | 32,373 |
| 30% | 30.1% | 24,644 | 24,709 |
| 20% | 20.1% | 16,429 | 16,481 |
| 10% | 10.1% | 8,215 | 8,283 |
| Active Idle | 0 | 0 | |

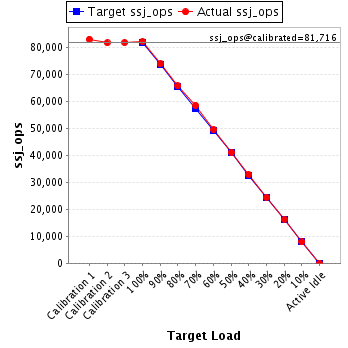
| Target Load | Actual Load | ssj_ops | |
|---|---|---|---|
| Target | Actual | ||
| Calibration 1 | 83,035 | ||
| Calibration 2 | 81,669 | ||
| Calibration 3 | 81,762 | ||
| ssj_ops@calibrated=81,716 | |||
| 100% | 100.5% | 81,716 | 82,097 |
| 90% | 90.4% | 73,544 | 73,845 |
| 80% | 80.4% | 65,373 | 65,736 |
| 70% | 71.6% | 57,201 | 58,506 |
| 60% | 60.6% | 49,030 | 49,507 |
| 50% | 50.3% | 40,858 | 41,073 |
| 40% | 40.1% | 32,686 | 32,801 |
| 30% | 30.0% | 24,515 | 24,513 |
| 20% | 20.0% | 16,343 | 16,308 |
| 10% | 9.7% | 8,172 | 7,892 |
| Active Idle | 0 | 0 | |
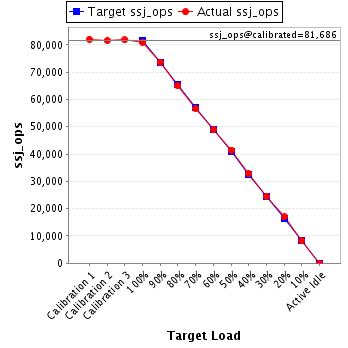
| Target Load | Actual Load | ssj_ops | |
|---|---|---|---|
| Target | Actual | ||
| Calibration 1 | 82,089 | ||
| Calibration 2 | 81,569 | ||
| Calibration 3 | 81,803 | ||
| ssj_ops@calibrated=81,686 | |||
| 100% | 99.2% | 81,686 | 81,017 |
| 90% | 90.2% | 73,517 | 73,685 |
| 80% | 79.6% | 65,349 | 65,039 |
| 70% | 69.3% | 57,180 | 56,634 |
| 60% | 59.8% | 49,011 | 48,873 |
| 50% | 50.8% | 40,843 | 41,479 |
| 40% | 40.1% | 32,674 | 32,720 |
| 30% | 30.0% | 24,506 | 24,545 |
| 20% | 20.7% | 16,337 | 16,950 |
| 10% | 10.1% | 8,169 | 8,216 |
| Active Idle | 0 | 0 | |
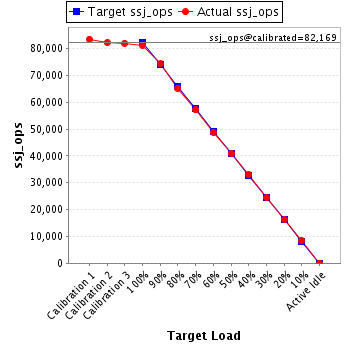
| Target Load | Actual Load | ssj_ops | |
|---|---|---|---|
| Target | Actual | ||
| Calibration 1 | 83,555 | ||
| Calibration 2 | 82,246 | ||
| Calibration 3 | 82,093 | ||
| ssj_ops@calibrated=82,169 | |||
| 100% | 99.0% | 82,169 | 81,355 |
| 90% | 90.4% | 73,952 | 74,321 |
| 80% | 79.4% | 65,735 | 65,253 |
| 70% | 69.6% | 57,518 | 57,162 |
| 60% | 59.3% | 49,301 | 48,738 |
| 50% | 49.8% | 41,085 | 40,961 |
| 40% | 40.3% | 32,868 | 33,153 |
| 30% | 29.7% | 24,651 | 24,444 |
| 20% | 19.7% | 16,434 | 16,211 |
| 10% | 10.2% | 8,217 | 8,392 |
| Active Idle | 0 | 0 | |