
SPECpower_ssj2008
Host '0001' Performance Report
Copyright © 2007-2009 Standard Performance Evaluation Corporation
| Fujitsu PRIMERGY TX300 S4 (Intel Xeon L5430) | ssj_ops@100% = 326,128 ssj_ops@100% per JVM = 81,532 |
||||
| Test Sponsor: | Fujitsu | SPEC License #: | 19 | Test Method: | Single Node |
| Tested By: | Fujitsu Siemens Computers | Test Location: | Paderborn, NRW, Germany | Test Date: | 18.02.2009 |
| Hardware Availability: | Sep-2008 | Software Availability: | May-2009 | Publication: | Mar 11, 2009 |
| System Source: | Single Supplier | System Designation: | Server | Power Provisioning: | Line-powered |
| Target Load | Actual Load | ssj_ops | |
|---|---|---|---|
| Target | Actual | ||
| Calibration 1 | 331,941 | ||
| Calibration 2 | 327,657 | ||
| Calibration 3 | 327,511 | ||
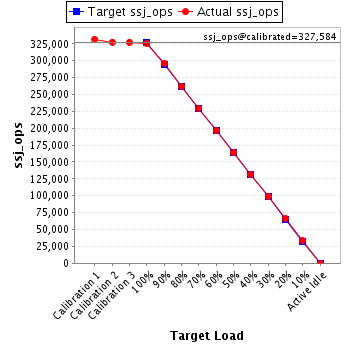
| ssj_ops@calibrated=327,584 | |||
| 100% | 99.6% | 327,584 | 326,128 |
| 90% | 90.4% | 294,826 | 296,249 |
| 80% | 80.1% | 262,067 | 262,410 |
| 70% | 70.0% | 229,309 | 229,390 |
| 60% | 60.0% | 196,551 | 196,676 |
| 50% | 49.9% | 163,792 | 163,458 |
| 40% | 40.2% | 131,034 | 131,554 |
| 30% | 30.0% | 98,275 | 98,437 |
| 20% | 20.2% | 65,517 | 66,094 |
| 10% | 10.1% | 32,758 | 32,983 |
| Active Idle | 0 | 0 | |
| Set Identifier: | sut |
| Set Description: | PRIMERGY TX300 S4 (Intel Xeon L5430) |
| # of Identical Nodes: | 1 |
| Comment: | None |
| Hardware | |
|---|---|
| Hardware Vendor: | Fujitsu |
| Model: | PRIMERGY TX300 S4 (Intel Xeon L5430) |
| Form Factor: | -- |
| CPU Name: | Intel Xeon L5430 |
| CPU Characteristics: | 2.66GHz, 2x6MB L2 cache, 1333MHz system bus |
| CPU Frequency (MHz): | 2667 |
| CPU(s) Enabled: | 8 cores, 2 chips, 4 cores/chip |
| Hardware Threads: | 8 (1 / core) |
| CPU(s) Orderable: | 1,2 chips |
| Primary Cache: | 32 KB I + 32 KB D on chip per core |
| Secondary Cache: | 12 MB I+D on chip per chip, 6 MB shared / 2 cores |
| Tertiary Cache: | None |
| Other Cache: | None |
| Memory Amount (GB): | 8 |
| # and size of DIMM: | 4 x 2048 MB |
| Memory Details: | 8GB 2Rx8 PC2-5300F ECC CL5; slots 1A, 1B, 1C, 1D populated |
| Power Supply Quantity and Rating (W): | 1 x 700 |
| Power Supply Details: | HIPRO HP-W700WC3 |
| Disk Drive: | 1 x Seagate (3.5", SATA, 250GB, 7.2krpm) |
| Disk Controller: | LSI Logic Integrated SAS 3000 Series, 8-port with 1068E |
| # and type of Network Interface Cards (NICs) Installed: | 2 x Broadcom BCM5708C NetXtreme II GigE (onboard) |
| NICs Enabled in Firmware / OS / Connected: | 1/1/1 |
| Network Speed (Mbit): | 1000 |
| Keyboard: | KVM |
| Mouse: | KVM |
| Monitor: | KVM |
| Optical Drives: | No |
| Other Hardware: | None |
| Software | |
|---|---|
| Power Management: | Enabled ("Balanced" power scheme) |
| Operating System (OS): | Microsoft Windows Server 2008 Enterprise x64 Edition + SP2 |
| OS Version: | Version 6.0.6002 Service Pack 2, v.641 Build 6002 |
| Filesystem: | NTFS |
| JVM Vendor: | Oracle Corporation |
| JVM Version: | Oracle JRockit(R) 6 P28.0.0 (build P28.0.0-8-109238-1.6.0_05-20090130-1408-windows-x86_64) |
| JVM Command-line Options: | -Xms1700m -Xmx1700m -Xns1500m -XXaggressive -Xlargepages -Xgc:genpar -XXcallprofiling -XXgcthreads=2 -XXtlasize:min=4k,preferred=1024k -XXthroughputcompaction -XX:+UseStringCache |
| JVM Affinity: | start /affinity [0x03,0x30,0x0C,0xC0] |
| JVM Instances: | 8 |
| JVM Initial Heap (MB): | 1700 |
| JVM Maximum Heap (MB): | 1700 |
| JVM Address Bits: | 64 |
| Boot Firmware Version: | -- |
| Management Firmware Version: | -- |
| Workload Version: | SSJ 1.1.3 |
| Director Location: | Controller |
| Other Software: | None |
| JVM Instance | ssj_ops@100% |
|---|---|
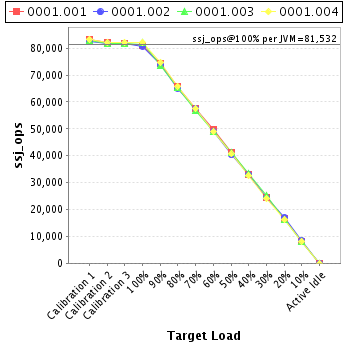
| 0001.001 | 81,093 |
| 0001.002 | 80,813 |
| 0001.003 | 81,942 |
| 0001.004 | 82,280 |
| ssj_ops@100% | 326,128 |
| ssj_ops@100% per JVM | 81,532 |
| Target Load | Actual Load | ssj_ops | |
|---|---|---|---|
| Target | Actual | ||
| Calibration 1 | 83,312 | ||
| Calibration 2 | 82,082 | ||
| Calibration 3 | 81,818 | ||
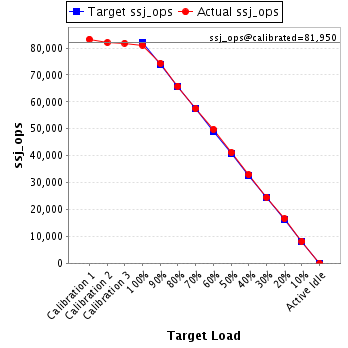
| ssj_ops@calibrated=81,950 | |||
| 100% | 99.0% | 81,950 | 81,093 |
| 90% | 90.7% | 73,755 | 74,353 |
| 80% | 80.3% | 65,560 | 65,791 |
| 70% | 70.2% | 57,365 | 57,508 |
| 60% | 60.8% | 49,170 | 49,791 |
| 50% | 50.3% | 40,975 | 41,192 |
| 40% | 40.2% | 32,780 | 32,953 |
| 30% | 29.9% | 24,585 | 24,539 |
| 20% | 20.3% | 16,390 | 16,616 |
| 10% | 10.0% | 8,195 | 8,158 |
| Active Idle | 0 | 0 | |
| Target Load | Actual Load | ssj_ops | |
|---|---|---|---|
| Target | Actual | ||
| Calibration 1 | 82,482 | ||
| Calibration 2 | 81,686 | ||
| Calibration 3 | 81,801 | ||
| ssj_ops@calibrated=81,744 | |||
| 100% | 98.9% | 81,744 | 80,813 |
| 90% | 90.3% | 73,569 | 73,785 |
| 80% | 79.7% | 65,395 | 65,189 |
| 70% | 70.5% | 57,221 | 57,598 |
| 60% | 60.0% | 49,046 | 49,047 |
| 50% | 49.3% | 40,872 | 40,303 |
| 40% | 40.2% | 32,697 | 32,844 |
| 30% | 29.9% | 24,523 | 24,460 |
| 20% | 20.8% | 16,349 | 16,979 |
| 10% | 10.3% | 8,174 | 8,429 |
| Active Idle | 0 | 0 | |

| Target Load | Actual Load | ssj_ops | |
|---|---|---|---|
| Target | Actual | ||
| Calibration 1 | 82,782 | ||
| Calibration 2 | 81,855 | ||
| Calibration 3 | 81,851 | ||
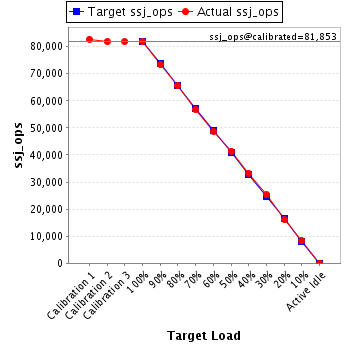
| ssj_ops@calibrated=81,853 | |||
| 100% | 100.1% | 81,853 | 81,942 |
| 90% | 89.7% | 73,668 | 73,439 |
| 80% | 80.1% | 65,482 | 65,547 |
| 70% | 69.4% | 57,297 | 56,822 |
| 60% | 59.7% | 49,112 | 48,847 |
| 50% | 50.5% | 40,926 | 41,297 |
| 40% | 40.6% | 32,741 | 33,209 |
| 30% | 30.9% | 24,556 | 25,286 |
| 20% | 19.8% | 16,371 | 16,209 |
| 10% | 10.0% | 8,185 | 8,225 |
| Active Idle | 0 | 0 | |
| Target Load | Actual Load | ssj_ops | |
|---|---|---|---|
| Target | Actual | ||
| Calibration 1 | 83,364 | ||
| Calibration 2 | 82,034 | ||
| Calibration 3 | 82,040 | ||
| ssj_ops@calibrated=82,037 | |||
| 100% | 100.3% | 82,037 | 82,280 |
| 90% | 91.0% | 73,834 | 74,672 |
| 80% | 80.3% | 65,630 | 65,883 |
| 70% | 70.0% | 57,426 | 57,462 |
| 60% | 59.7% | 49,222 | 48,991 |
| 50% | 49.6% | 41,019 | 40,666 |
| 40% | 39.7% | 32,815 | 32,547 |
| 30% | 29.4% | 24,611 | 24,152 |
| 20% | 19.9% | 16,407 | 16,291 |
| 10% | 10.0% | 8,204 | 8,171 |
| Active Idle | 0 | 0 | |
