SPECpower_ssj2008
Host '0001' Performance Report
Copyright © 2007-2009 Standard Performance Evaluation Corporation
| Sun Microsystems, Inc. Sun Netra X4250 | ssj_ops@100% = 244,832 ssj_ops@100% per JVM = 61,208 |
||||
| Test Sponsor: | Sun Microsystems, Inc. | SPEC License #: | 6 | Test Method: | Single Node |
| Tested By: | Sun Microsystems, Inc. | Test Location: | Burlington, MA, USA | Test Date: | Mar 10, 2009 |
| Hardware Availability: | Jul-2008 | Software Availability: | May-2009 | Publication: | Mar 30, 2009 |
| System Source: | Single Supplier | System Designation: | Server | Power Provisioning: | Line-powered |
| Target Load | Actual Load | ssj_ops | |
|---|---|---|---|
| Target | Actual | ||
| Calibration 1 | 245,546 | ||
| Calibration 2 | 246,662 | ||
| Calibration 3 | 246,286 | ||
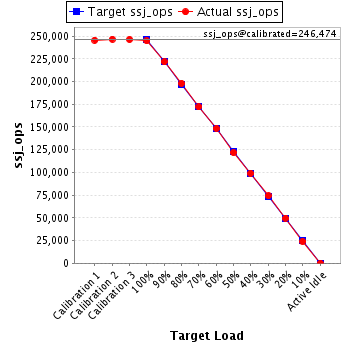
| ssj_ops@calibrated=246,474 | |||
| 100% | 99.3% | 246,474 | 244,832 |
| 90% | 89.9% | 221,827 | 221,632 |
| 80% | 80.4% | 197,179 | 198,107 |
| 70% | 69.8% | 172,532 | 172,051 |
| 60% | 60.2% | 147,884 | 148,433 |
| 50% | 49.4% | 123,237 | 121,828 |
| 40% | 40.2% | 98,590 | 99,037 |
| 30% | 30.1% | 73,942 | 74,202 |
| 20% | 20.2% | 49,295 | 49,752 |
| 10% | 9.8% | 24,647 | 24,150 |
| Active Idle | 0 | 0 | |
| Set Identifier: | sut |
| Set Description: | Sun Netra X4250 |
| # of Identical Nodes: | 1 |
| Comment: | None |
| Hardware | |
|---|---|
| Hardware Vendor: | Sun Microsystems, Inc. |
| Model: | Sun Netra X4250 |
| Form Factor: | -- |
| CPU Name: | Intel Xeon L5408 |
| CPU Characteristics: | Quad-Core, 2.13 GHz, 2x6MB shared L2 cache, 1066 MHz system bus |
| CPU Frequency (MHz): | 2133 |
| CPU(s) Enabled: | 8 cores, 2 chips, 4 cores/chip |
| Hardware Threads: | 8 (1 / core) |
| CPU(s) Orderable: | 1,2 chips |
| Primary Cache: | 32 KB I + 32 KB D on chip per core |
| Secondary Cache: | 12 MB I+D on chip per chip, 6 MB shared / 2 cores |
| Tertiary Cache: | None |
| Other Cache: | None |
| Memory Amount (GB): | 8 |
| # and size of DIMM: | 4 x 2048 MB |
| Memory Details: | PC2-5300F 2Rx8 (Sun P/N 371-3068-01); slots A0,B0,C0,D0 populated |
| Power Supply Quantity and Rating (W): | 2 x 658 |
| Power Supply Details: | Sun P/N 300-2015 |
| Disk Drive: | 1 x Sun 146GB 10K RPM SAS (Sun P/N 540-7152) |
| Disk Controller: | Integrated SAS controller |
| # and type of Network Interface Cards (NICs) Installed: | 4 x on-board Intel Gigabit Ethernet |
| NICs Enabled in Firmware / OS / Connected: | 4/1/1 |
| Network Speed (Mbit): | 1000 |
| Keyboard: | None |
| Mouse: | None |
| Monitor: | None |
| Optical Drives: | No |
| Other Hardware: | None |
| Software | |
|---|---|
| Power Management: | Enabled (Server Balanced Processor Power and Performance) |
| Operating System (OS): | Microsoft Windows Server 2003 R2, Enterprise x64 Edition with Service Pack 2 |
| OS Version: | Version 5.2 R2 (Build 3790.srv03_sp2_rtm.070216-1710: Service Pack 2) (64 bit) |
| Filesystem: | NTFS |
| JVM Vendor: | Sun Microsystems, Inc. |
| JVM Version: | Java HotSpot(TM) 32-Bit Server VM on Windows version 1.6.0_14 |
| JVM Command-line Options: | -server -Xmx1400m -Xms1400m -Xmn1150m -XX:+AggressiveOpts -XX:+UseParallelOldGC -XX:ParallelGCThreads=2 -XX:+UseStringCache -XX:PermSize=12m -XX:MaxPermSize=12m -XX:+UseLargePages -XX:AllocatePrefetchStyle=2 -XX:BiasedLockingStartupDelay=500 |
| JVM Affinity: | start /affinity [0x03,0x30,0x0C,0xC0] |
| JVM Instances: | 8 |
| JVM Initial Heap (MB): | 1400 |
| JVM Maximum Heap (MB): | 1400 |
| JVM Address Bits: | 32 |
| Boot Firmware Version: | -- |
| Management Firmware Version: | -- |
| Workload Version: | SSJ 1.1.3 |
| Director Location: | Controller |
| Other Software: | Platform-specific drivers installed from Sun Netra X4250 Tools and Drivers DVD Version 2.1N |
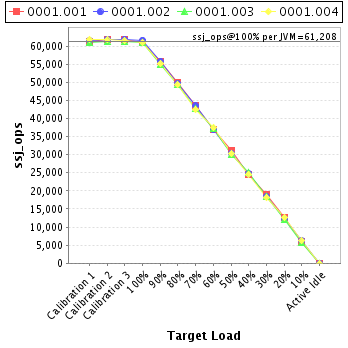
| JVM Instance | ssj_ops@100% |
|---|---|
| 0001.001 | 61,027 |
| 0001.002 | 61,619 |
| 0001.003 | 61,081 |
| 0001.004 | 61,104 |
| ssj_ops@100% | 244,832 |
| ssj_ops@100% per JVM | 61,208 |
| Target Load | Actual Load | ssj_ops | |
|---|---|---|---|
| Target | Actual | ||
| Calibration 1 | 61,267 | ||
| Calibration 2 | 61,857 | ||
| Calibration 3 | 61,729 | ||
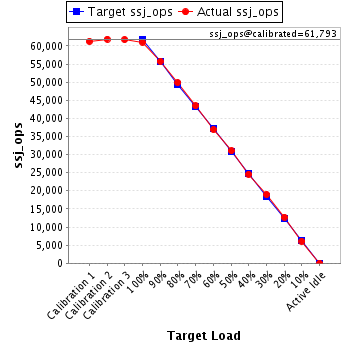
| ssj_ops@calibrated=61,793 | |||
| 100% | 98.8% | 61,793 | 61,027 |
| 90% | 90.2% | 55,614 | 55,762 |
| 80% | 80.7% | 49,434 | 49,874 |
| 70% | 70.3% | 43,255 | 43,443 |
| 60% | 59.8% | 37,076 | 36,927 |
| 50% | 50.3% | 30,897 | 31,057 |
| 40% | 39.8% | 24,717 | 24,604 |
| 30% | 30.7% | 18,538 | 18,991 |
| 20% | 20.6% | 12,359 | 12,737 |
| 10% | 9.8% | 6,179 | 6,079 |
| Active Idle | 0 | 0 | |
| Target Load | Actual Load | ssj_ops | |
|---|---|---|---|
| Target | Actual | ||
| Calibration 1 | 61,560 | ||
| Calibration 2 | 61,896 | ||
| Calibration 3 | 61,797 | ||
| ssj_ops@calibrated=61,846 | |||
| 100% | 99.6% | 61,846 | 61,619 |
| 90% | 90.2% | 55,662 | 55,766 |
| 80% | 80.2% | 49,477 | 49,584 |
| 70% | 70.3% | 43,293 | 43,459 |
| 60% | 59.5% | 37,108 | 36,816 |
| 50% | 49.2% | 30,923 | 30,428 |
| 40% | 40.0% | 24,739 | 24,764 |
| 30% | 29.9% | 18,554 | 18,473 |
| 20% | 20.0% | 12,369 | 12,354 |
| 10% | 10.1% | 6,185 | 6,217 |
| Active Idle | 0 | 0 | |

| Target Load | Actual Load | ssj_ops | |
|---|---|---|---|
| Target | Actual | ||
| Calibration 1 | 60,948 | ||
| Calibration 2 | 61,221 | ||
| Calibration 3 | 61,321 | ||
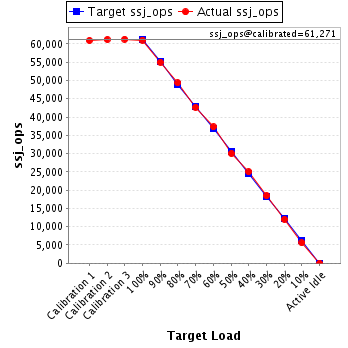
| ssj_ops@calibrated=61,271 | |||
| 100% | 99.7% | 61,271 | 61,081 |
| 90% | 89.8% | 55,144 | 55,004 |
| 80% | 80.5% | 49,017 | 49,344 |
| 70% | 69.7% | 42,890 | 42,698 |
| 60% | 60.9% | 36,763 | 37,316 |
| 50% | 49.0% | 30,635 | 30,050 |
| 40% | 40.8% | 24,508 | 25,023 |
| 30% | 30.1% | 18,381 | 18,458 |
| 20% | 19.6% | 12,254 | 12,012 |
| 10% | 9.2% | 6,127 | 5,617 |
| Active Idle | 0 | 0 | |
| Target Load | Actual Load | ssj_ops | |
|---|---|---|---|
| Target | Actual | ||
| Calibration 1 | 61,771 | ||
| Calibration 2 | 61,688 | ||
| Calibration 3 | 61,440 | ||
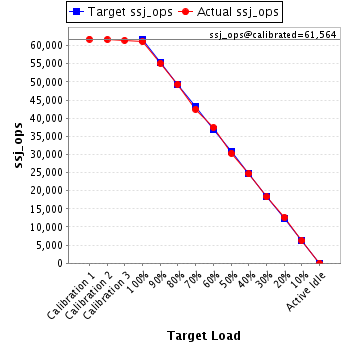
| ssj_ops@calibrated=61,564 | |||
| 100% | 99.3% | 61,564 | 61,104 |
| 90% | 89.5% | 55,407 | 55,100 |
| 80% | 80.1% | 49,251 | 49,306 |
| 70% | 69.0% | 43,095 | 42,451 |
| 60% | 60.7% | 36,938 | 37,373 |
| 50% | 49.2% | 30,782 | 30,293 |
| 40% | 40.0% | 24,625 | 24,646 |
| 30% | 29.7% | 18,469 | 18,279 |
| 20% | 20.5% | 12,313 | 12,648 |
| 10% | 10.1% | 6,156 | 6,238 |
| Active Idle | 0 | 0 | |