SPECpower_ssj2008
Host '0001' Performance Report
Copyright © 2007-2009 Standard Performance Evaluation Corporation
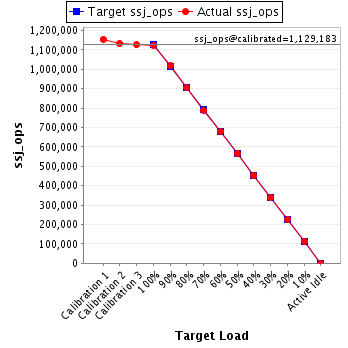
| Hewlett-Packard Company ProLiant DL785 G5 (2.50GHz, AMD Opteron 8381 HE) | ssj_ops@100% = 1,123,158 ssj_ops@100% per JVM = 140,395 |
||||
| Test Sponsor: | Hewlett-Packard Company | SPEC License #: | 3 | Test Method: | Single Node |
| Tested By: | Hewlett-Packard Company | Test Location: | Cupertino, CA, USA | Test Date: | Apr 15, 2009 |
| Hardware Availability: | Jun-2009 | Software Availability: | May-2009 | Publication: | Jun 3, 2009 |
| System Source: | Single Supplier | System Designation: | Server | Power Provisioning: | Line-powered |
| Target Load | Actual Load | ssj_ops | |
|---|---|---|---|
| Target | Actual | ||
| Calibration 1 | 1,155,021 | ||
| Calibration 2 | 1,132,743 | ||
| Calibration 3 | 1,125,622 | ||
| ssj_ops@calibrated=1,129,183 | |||
| 100% | 99.5% | 1,129,183 | 1,123,158 |
| 90% | 90.1% | 1,016,264 | 1,016,891 |
| 80% | 80.0% | 903,346 | 903,399 |
| 70% | 69.8% | 790,428 | 787,767 |
| 60% | 60.1% | 677,510 | 678,362 |
| 50% | 50.0% | 564,591 | 564,590 |
| 40% | 40.2% | 451,673 | 453,405 |
| 30% | 30.0% | 338,755 | 338,645 |
| 20% | 20.0% | 225,837 | 225,706 |
| 10% | 10.2% | 112,918 | 114,637 |
| Active Idle | 0 | 0 | |
| Set Identifier: | sut |
| Set Description: | ProLiant DL785 G5 (2.50GHz, AMD Opteron 8381 HE) |
| # of Identical Nodes: | 1 |
| Comment: | None |
| Hardware | |
|---|---|
| Hardware Vendor: | Hewlett-Packard Company |
| Model: | ProLiant DL785 G5 (2.50GHz, AMD Opteron 8381 HE) |
| Form Factor: | 7U |
| CPU Name: | Quad-Core AMD Opteron(r) Processor 8381 HE |
| CPU Characteristics: | Quad-Core, 2.5GHz, 6MB L3 Cache |
| CPU Frequency (MHz): | 2500 |
| CPU(s) Enabled: | 32 cores, 8 chips, 4 cores/chip |
| Hardware Threads: | 32 (1 / core) |
| CPU(s) Orderable: | 4,8 chips |
| Primary Cache: | 64 KB I + 64 KB D on chip per core |
| Secondary Cache: | 512 KB I+D on chip per chip |
| Tertiary Cache: | 6 MB I+D off chip per chip |
| Other Cache: | None |
| Memory Amount (GB): | 32 |
| # and size of DIMM: | 16 x 2048 MB |
| Memory Details: | 4GB Reg PC2-5300 2x2GB LP Kit 483401-B21; slots 1 and 2 populated on each board |
| Power Supply Quantity and Rating (W): | 3 x 1200 |
| Power Supply Details: | HP P/N 437572-B21 |
| Disk Drive: | 1 x 73GB 10K RPM SAS |
| Disk Controller: | Integrated P400i SmartArray controller |
| # and type of Network Interface Cards (NICs) Installed: | 2 x NC373i NIC |
| NICs Enabled in Firmware / OS / Connected: | 2/2/1 |
| Network Speed (Mbit): | 1000 |
| Keyboard: | KVM |
| Mouse: | KVM |
| Monitor: | None |
| Optical Drives: | Yes |
| Other Hardware: | none |
| Software | |
|---|---|
| Power Management: | OS Control Mode enabled |
| Operating System (OS): | Microsoft Windows Server 2008 x64 Enterprise Edition |
| OS Version: | Build 6002: Service Pack 2 |
| Filesystem: | NTFS |
| JVM Vendor: | Oracle |
| JVM Version: | Oracle JRockit(R) (build P28.0.0-8-109238-1.6.0_05-20090130-1408-windows-x86_64, compiled mode) |
| JVM Command-line Options: | -Xms3600m -Xmx3600m -Xns3100m -XXaggressive -XlargePages -XXthroughputCompaction -XXcallprofiling -Xgc:genpar -XXgcthreads:4 -XXtlasize:min=12k,preferred=1024k |
| JVM Affinity: | Used "start /AFFINITY" "0xF","0xF0","0xF00","0xF000","0xF0000","0xF00000","0xF000000" and "0xF0000000" CPU masks. |
| JVM Instances: | 16 |
| JVM Initial Heap (MB): | 3600 |
| JVM Maximum Heap (MB): | 3600 |
| JVM Address Bits: | 64 |
| Boot Firmware Version: | A15 05/05/2009 |
| Management Firmware Version: | 1.70 |
| Workload Version: | SSJ 1.1.3 |
| Director Location: | Controller |
| Other Software: | None |
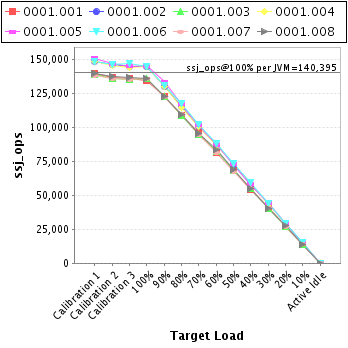
| JVM Instance | ssj_ops@100% |
|---|---|
| 0001.001 | 134,737 |
| 0001.002 | 144,698 |
| 0001.003 | 136,023 |
| 0001.004 | 144,778 |
| 0001.005 | 145,750 |
| 0001.006 | 145,100 |
| 0001.007 | 135,913 |
| 0001.008 | 136,159 |
| ssj_ops@100% | 1,123,158 |
| ssj_ops@100% per JVM | 140,395 |
| Target Load | Actual Load | ssj_ops | |
|---|---|---|---|
| Target | Actual | ||
| Calibration 1 | 140,121 | ||
| Calibration 2 | 136,949 | ||
| Calibration 3 | 136,432 | ||
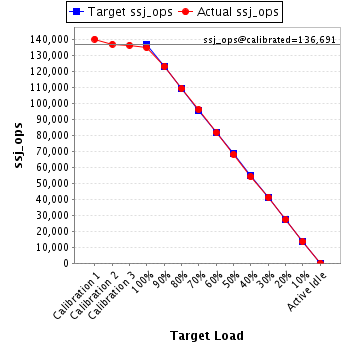
| ssj_ops@calibrated=136,691 | |||
| 100% | 98.6% | 136,691 | 134,737 |
| 90% | 90.0% | 123,022 | 123,081 |
| 80% | 79.9% | 109,353 | 109,265 |
| 70% | 70.3% | 95,684 | 96,122 |
| 60% | 59.8% | 82,014 | 81,762 |
| 50% | 49.8% | 68,345 | 68,067 |
| 40% | 39.6% | 54,676 | 54,086 |
| 30% | 30.2% | 41,007 | 41,292 |
| 20% | 20.0% | 27,338 | 27,285 |
| 10% | 9.9% | 13,669 | 13,562 |
| Active Idle | 0 | 0 | |
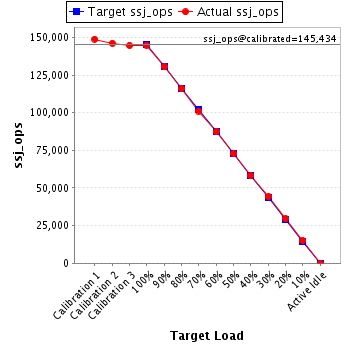
| Target Load | Actual Load | ssj_ops | |
|---|---|---|---|
| Target | Actual | ||
| Calibration 1 | 148,830 | ||
| Calibration 2 | 146,155 | ||
| Calibration 3 | 144,712 | ||
| ssj_ops@calibrated=145,434 | |||
| 100% | 99.5% | 145,434 | 144,698 |
| 90% | 89.7% | 130,890 | 130,455 |
| 80% | 79.6% | 116,347 | 115,790 |
| 70% | 69.5% | 101,803 | 101,119 |
| 60% | 60.1% | 87,260 | 87,382 |
| 50% | 49.9% | 72,717 | 72,611 |
| 40% | 40.0% | 58,173 | 58,162 |
| 30% | 30.4% | 43,630 | 44,246 |
| 20% | 20.3% | 29,087 | 29,453 |
| 10% | 10.3% | 14,543 | 15,011 |
| Active Idle | 0 | 0 | |
| Target Load | Actual Load | ssj_ops | |
|---|---|---|---|
| Target | Actual | ||
| Calibration 1 | 139,153 | ||
| Calibration 2 | 136,522 | ||
| Calibration 3 | 135,573 | ||
| ssj_ops@calibrated=136,047 | |||
| 100% | 100.0% | 136,047 | 136,023 |
| 90% | 90.3% | 122,443 | 122,870 |
| 80% | 80.1% | 108,838 | 108,971 |
| 70% | 69.9% | 95,233 | 95,119 |
| 60% | 60.4% | 81,628 | 82,184 |
| 50% | 50.0% | 68,024 | 68,068 |
| 40% | 40.3% | 54,419 | 54,816 |
| 30% | 29.6% | 40,814 | 40,289 |
| 20% | 20.1% | 27,209 | 27,292 |
| 10% | 10.1% | 13,605 | 13,789 |
| Active Idle | 0 | 0 | |

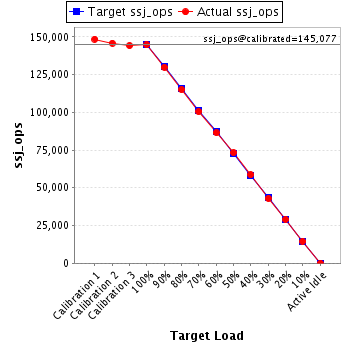
| Target Load | Actual Load | ssj_ops | |
|---|---|---|---|
| Target | Actual | ||
| Calibration 1 | 148,505 | ||
| Calibration 2 | 145,892 | ||
| Calibration 3 | 144,262 | ||
| ssj_ops@calibrated=145,077 | |||
| 100% | 99.8% | 145,077 | 144,778 |
| 90% | 89.6% | 130,569 | 129,923 |
| 80% | 79.3% | 116,061 | 115,061 |
| 70% | 69.3% | 101,554 | 100,479 |
| 60% | 59.6% | 87,046 | 86,449 |
| 50% | 50.5% | 72,538 | 73,242 |
| 40% | 40.4% | 58,031 | 58,633 |
| 30% | 29.7% | 43,523 | 43,021 |
| 20% | 20.0% | 29,015 | 29,049 |
| 10% | 10.1% | 14,508 | 14,600 |
| Active Idle | 0 | 0 | |
| Target Load | Actual Load | ssj_ops | |
|---|---|---|---|
| Target | Actual | ||
| Calibration 1 | 151,150 | ||
| Calibration 2 | 147,166 | ||
| Calibration 3 | 145,028 | ||
| ssj_ops@calibrated=146,097 | |||
| 100% | 99.8% | 146,097 | 145,750 |
| 90% | 91.7% | 131,488 | 133,927 |
| 80% | 80.3% | 116,878 | 117,334 |
| 70% | 69.7% | 102,268 | 101,873 |
| 60% | 59.8% | 87,658 | 87,364 |
| 50% | 49.9% | 73,049 | 72,845 |
| 40% | 40.0% | 58,439 | 58,401 |
| 30% | 30.2% | 43,829 | 44,179 |
| 20% | 19.9% | 29,219 | 29,066 |
| 10% | 10.2% | 14,610 | 14,855 |
| Active Idle | 0 | 0 | |

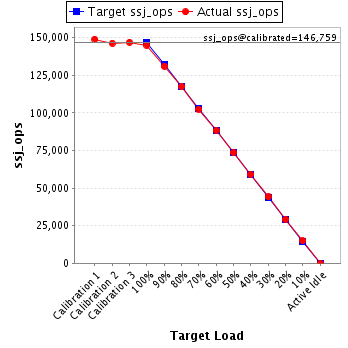
| Target Load | Actual Load | ssj_ops | |
|---|---|---|---|
| Target | Actual | ||
| Calibration 1 | 149,044 | ||
| Calibration 2 | 146,409 | ||
| Calibration 3 | 147,110 | ||
| ssj_ops@calibrated=146,759 | |||
| 100% | 98.9% | 146,759 | 145,100 |
| 90% | 89.3% | 132,083 | 131,106 |
| 80% | 80.2% | 117,407 | 117,645 |
| 70% | 69.9% | 102,732 | 102,540 |
| 60% | 60.2% | 88,056 | 88,367 |
| 50% | 50.1% | 73,380 | 73,529 |
| 40% | 40.4% | 58,704 | 59,314 |
| 30% | 30.1% | 44,028 | 44,233 |
| 20% | 19.9% | 29,352 | 29,182 |
| 10% | 10.2% | 14,676 | 14,937 |
| Active Idle | 0 | 0 | |
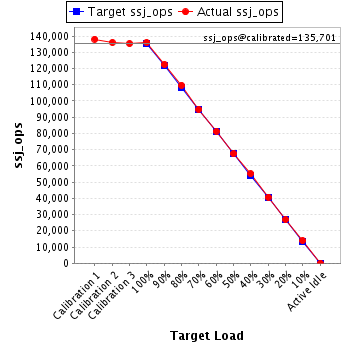
| Target Load | Actual Load | ssj_ops | |
|---|---|---|---|
| Target | Actual | ||
| Calibration 1 | 138,073 | ||
| Calibration 2 | 136,036 | ||
| Calibration 3 | 135,365 | ||
| ssj_ops@calibrated=135,701 | |||
| 100% | 100.2% | 135,701 | 135,913 |
| 90% | 90.3% | 122,130 | 122,470 |
| 80% | 80.8% | 108,560 | 109,653 |
| 70% | 69.9% | 94,990 | 94,852 |
| 60% | 60.0% | 81,420 | 81,361 |
| 50% | 49.6% | 67,850 | 67,373 |
| 40% | 40.6% | 54,280 | 55,121 |
| 30% | 30.1% | 40,710 | 40,784 |
| 20% | 19.8% | 27,140 | 26,866 |
| 10% | 10.3% | 13,570 | 13,958 |
| Active Idle | 0 | 0 | |
| Target Load | Actual Load | ssj_ops | |
|---|---|---|---|
| Target | Actual | ||
| Calibration 1 | 140,145 | ||
| Calibration 2 | 137,613 | ||
| Calibration 3 | 137,140 | ||
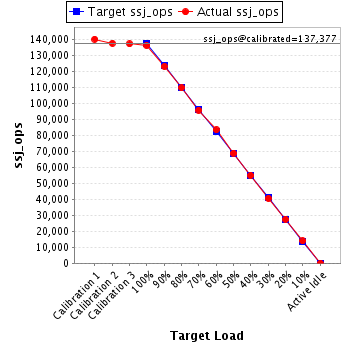
| ssj_ops@calibrated=137,377 | |||
| 100% | 99.1% | 137,377 | 136,159 |
| 90% | 89.6% | 123,639 | 123,060 |
| 80% | 79.8% | 109,902 | 109,681 |
| 70% | 69.6% | 96,164 | 95,663 |
| 60% | 60.8% | 82,426 | 83,492 |
| 50% | 50.1% | 68,688 | 68,855 |
| 40% | 39.9% | 54,951 | 54,873 |
| 30% | 29.6% | 41,213 | 40,601 |
| 20% | 20.0% | 27,475 | 27,514 |
| 10% | 10.1% | 13,738 | 13,926 |
| Active Idle | 0 | 0 | |