SPECpower_ssj2008
Host 'node1' Performance Report
Copyright © 2007-2009 Standard Performance Evaluation Corporation
| Hewlett-Packard Company ProLiant SL2x170z G6 (2.4 GHz, Intel Xeon L5530) | ssj_ops@100% = 525,961 ssj_ops@100% per JVM = 131,490 |
||||
| Test Sponsor: | Hewlett-Packard Company | SPEC License #: | 3 | Test Method: | Multi Node |
| Tested By: | Hewlett-Packard Company | Test Location: | Houston, TX, USA | Test Date: | Sep 3, 2009 |
| Hardware Availability: | Oct-2009 | Software Availability: | Jul-2009 | Publication: | Nov 4, 2009 |
| System Source: | Single Supplier | System Designation: | Server | Power Provisioning: | Line-powered |
| Target Load | Actual Load | ssj_ops | |
|---|---|---|---|
| Target | Actual | ||
| Calibration 1 | 525,181 | ||
| Calibration 2 | 529,957 | ||
| Calibration 3 | 529,509 | ||
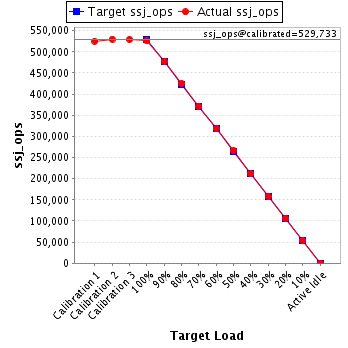
| ssj_ops@calibrated=529,733 | |||
| 100% | 99.3% | 529,733 | 525,961 |
| 90% | 90.0% | 476,760 | 476,700 |
| 80% | 80.3% | 423,786 | 425,525 |
| 70% | 70.1% | 370,813 | 371,486 |
| 60% | 60.2% | 317,840 | 318,734 |
| 50% | 50.2% | 264,866 | 265,815 |
| 40% | 40.0% | 211,893 | 212,044 |
| 30% | 30.0% | 158,920 | 158,985 |
| 20% | 20.1% | 105,947 | 106,664 |
| 10% | 10.2% | 52,973 | 54,182 |
| Active Idle | 0 | 0 | |
| Set Identifier: | sut |
| Set Description: | ProLiant SL2x170z G6 |
| # of Identical Nodes: | 4 |
| Comment: | None |
| Hardware | |
|---|---|
| Hardware Vendor: | Hewlett-Packard Company |
| Model: | ProLiant SL2x170z G6 (2.4 GHz, Intel Xeon L5530) |
| Form Factor: | 2U |
| CPU Name: | Intel Xeon L5530 |
| CPU Characteristics: | Quad-Core, 2.40 GHz, 8 MB L3 cache |
| CPU Frequency (MHz): | 2400 |
| CPU(s) Enabled: | 8 cores, 2 chips, 4 cores/chip |
| Hardware Threads: | 16 (2 / core) |
| CPU(s) Orderable: | 1,2 chips |
| Primary Cache: | 32 KB I + 32 KB D on chip per core |
| Secondary Cache: | 256 KB I+D on chip per core |
| Tertiary Cache: | 8 MB I+D on chip per chip |
| Other Cache: | None |
| Memory Amount (GB): | 8 |
| # and size of DIMM: | 4 x 2048 MB |
| Memory Details: | 2GB 2Rx8 PC3-10600E; slots 1 and 4 are populated on each processor |
| Power Supply Quantity and Rating (W): | None |
| Power Supply Details: | Shared |
| Disk Drive: | 1 x 60GB SSD 2.5" SATA, HP part #:586585-B21 |
| Disk Controller: | Integrated SATA |
| # and type of Network Interface Cards (NICs) Installed: | 2 x HP NC362i Dual Port Multifunction Gigabit Server Adapters |
| NICs Enabled in Firmware / OS / Connected: | 2/2/1 |
| Network Speed (Mbit): | 1000 |
| Keyboard: | None |
| Mouse: | None |
| Monitor: | None |
| Optical Drives: | No |
| Other Hardware: | None |
| Software | |
|---|---|
| Power Management: | Power saver plan in OS |
| Operating System (OS): | Windows Server 2008 x64, Enterprise Edition |
| OS Version: | SP2 |
| Filesystem: | NTFS |
| JVM Vendor: | IBM Corporation |
| JVM Version: | IBM J9 VM (build 2.4, J2RE 1.6.0 IBM J9 2.4 Windows Server 2008 amd64-64 jvmwa6460sr5-20090519_35743 (JIT enabled, AOT enabled) |
| JVM Command-line Options: | -Xaggressive -Xcompressedrefs -Xgcpolicy:gencon -Xmn1100m -Xms1600m -Xmx1600m -XlockReservation -Xnoloa -XtlhPrefetch -Xlp -Xgcthreads4 |
| JVM Affinity: | start /affinity [0xF, 0xF0, 0xF00, 0xF000] |
| JVM Instances: | 4 |
| JVM Initial Heap (MB): | 1600 |
| JVM Maximum Heap (MB): | 1600 |
| JVM Address Bits: | 64 |
| Boot Firmware Version: | O34 8/25/09 |
| Management Firmware Version: | 4.04 7/1/09 |
| Workload Version: | SSJ 1.2.6 |
| Director Location: | Controller |
| Other Software: | NIC driver, HP component cp010296.exe. Driver version: 10.3.49.400 |
| JVM Instance | ssj_ops@100% |
|---|---|
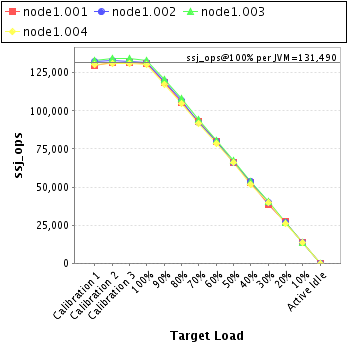
| node1.001 | 131,089 |
| node1.002 | 131,406 |
| node1.003 | 133,194 |
| node1.004 | 130,272 |
| ssj_ops@100% | 525,961 |
| ssj_ops@100% per JVM | 131,490 |
| Target Load | Actual Load | ssj_ops | |
|---|---|---|---|
| Target | Actual | ||
| Calibration 1 | 129,462 | ||
| Calibration 2 | 131,533 | ||
| Calibration 3 | 131,445 | ||
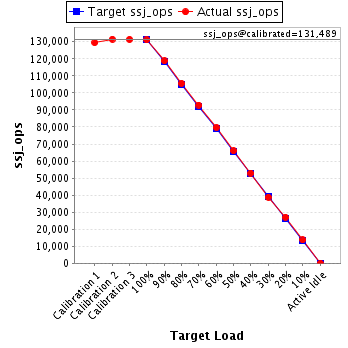
| ssj_ops@calibrated=131,489 | |||
| 100% | 99.7% | 131,489 | 131,089 |
| 90% | 90.4% | 118,340 | 118,820 |
| 80% | 80.4% | 105,191 | 105,656 |
| 70% | 70.6% | 92,042 | 92,890 |
| 60% | 60.6% | 78,893 | 79,695 |
| 50% | 50.2% | 65,745 | 65,944 |
| 40% | 40.3% | 52,596 | 52,963 |
| 30% | 29.5% | 39,447 | 38,829 |
| 20% | 20.6% | 26,298 | 27,074 |
| 10% | 10.4% | 13,149 | 13,662 |
| Active Idle | 0 | 0 | |
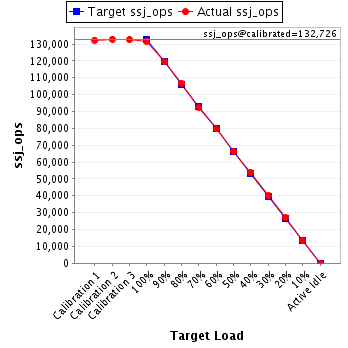
| Target Load | Actual Load | ssj_ops | |
|---|---|---|---|
| Target | Actual | ||
| Calibration 1 | 132,276 | ||
| Calibration 2 | 132,873 | ||
| Calibration 3 | 132,578 | ||
| ssj_ops@calibrated=132,726 | |||
| 100% | 99.0% | 132,726 | 131,406 |
| 90% | 90.0% | 119,453 | 119,403 |
| 80% | 80.4% | 106,181 | 106,774 |
| 70% | 69.7% | 92,908 | 92,502 |
| 60% | 60.0% | 79,635 | 79,624 |
| 50% | 49.9% | 66,363 | 66,269 |
| 40% | 40.6% | 53,090 | 53,862 |
| 30% | 30.1% | 39,818 | 39,889 |
| 20% | 20.2% | 26,545 | 26,845 |
| 10% | 10.2% | 13,273 | 13,474 |
| Active Idle | 0 | 0 | |
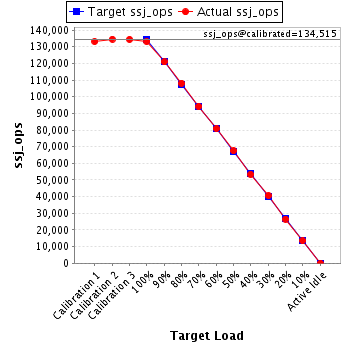
| Target Load | Actual Load | ssj_ops | |
|---|---|---|---|
| Target | Actual | ||
| Calibration 1 | 133,196 | ||
| Calibration 2 | 134,564 | ||
| Calibration 3 | 134,465 | ||
| ssj_ops@calibrated=134,515 | |||
| 100% | 99.0% | 134,515 | 133,194 |
| 90% | 89.9% | 121,063 | 120,884 |
| 80% | 80.4% | 107,612 | 108,175 |
| 70% | 70.0% | 94,160 | 94,185 |
| 60% | 60.1% | 80,709 | 80,838 |
| 50% | 50.1% | 67,257 | 67,452 |
| 40% | 39.7% | 53,806 | 53,379 |
| 30% | 30.2% | 40,354 | 40,650 |
| 20% | 19.8% | 26,903 | 26,569 |
| 10% | 10.1% | 13,451 | 13,550 |
| Active Idle | 0 | 0 | |
| Target Load | Actual Load | ssj_ops | |
|---|---|---|---|
| Target | Actual | ||
| Calibration 1 | 130,247 | ||
| Calibration 2 | 130,986 | ||
| Calibration 3 | 131,021 | ||
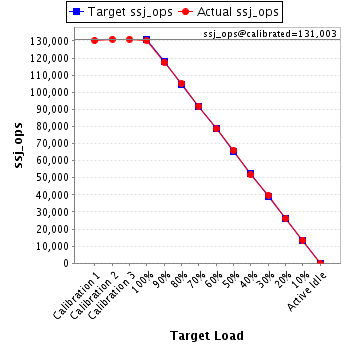
| ssj_ops@calibrated=131,003 | |||
| 100% | 99.4% | 131,003 | 130,272 |
| 90% | 89.8% | 117,903 | 117,592 |
| 80% | 80.1% | 104,803 | 104,920 |
| 70% | 70.2% | 91,702 | 91,909 |
| 60% | 60.0% | 78,602 | 78,578 |
| 50% | 50.5% | 65,502 | 66,149 |
| 40% | 39.6% | 52,401 | 51,840 |
| 30% | 30.2% | 39,301 | 39,616 |
| 20% | 20.0% | 26,201 | 26,176 |
| 10% | 10.3% | 13,100 | 13,496 |
| Active Idle | 0 | 0 | |