SPECpower_ssj2008
Host 'Node-10' Performance Report
Copyright © 2007-2010 Standard Performance Evaluation Corporation
| Fujitsu PRIMERGY CX120 S1 (Intel Xeon L5530) | ssj_ops@100% = 517,318 ssj_ops@100% per JVM = 129,330 |
||||
| Test Sponsor: | Fujitsu | SPEC License #: | 19 | Test Method: | Multi Node |
| Tested By: | Fujitsu | Test Location: | Paderborn, NRW, Germany | Test Date: | Mar 7, 2010 |
| Hardware Availability: | Jun-2010 | Software Availability: | Nov-2009 | Publication: | Mar 24, 2010 |
| System Source: | Single Supplier | System Designation: | Server | Power Provisioning: | Line-powered |
| Target Load | Actual Load | ssj_ops | |
|---|---|---|---|
| Target | Actual | ||
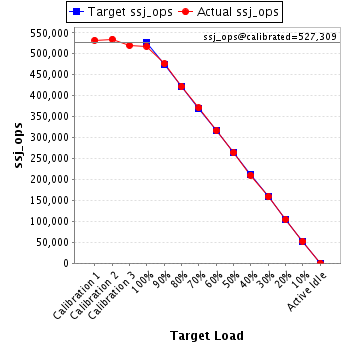
| Calibration 1 | 532,409 | ||
| Calibration 2 | 534,856 | ||
| Calibration 3 | 519,762 | ||
| ssj_ops@calibrated=527,309 | |||
| 100% | 98.1% | 527,309 | 517,318 |
| 90% | 90.4% | 474,578 | 476,628 |
| 80% | 80.0% | 421,847 | 421,893 |
| 70% | 70.3% | 369,116 | 370,775 |
| 60% | 60.1% | 316,385 | 316,706 |
| 50% | 50.0% | 263,655 | 263,792 |
| 40% | 39.8% | 210,924 | 209,885 |
| 30% | 30.1% | 158,193 | 158,767 |
| 20% | 19.9% | 105,462 | 104,736 |
| 10% | 10.0% | 52,731 | 52,668 |
| Active Idle | 0 | 0 | |
| Set Identifier: | SUT |
| Set Description: | Set of 38 identically configured PRIMERGY CX120 S1 servers |
| # of Identical Nodes: | 38 |
| Comment: | None |
| Hardware | |
|---|---|
| Hardware Vendor: | Fujitsu |
| Model: | PRIMERGY CX120 S1 (Intel Xeon L5530) |
| Form Factor: | 1U |
| CPU Name: | Intel Xeon L5530 |
| CPU Characteristics: | Quad-Core, 2.40GHz, 8MB L3 Cache |
| CPU Frequency (MHz): | 2400 |
| CPU(s) Enabled: | 8 cores, 2 chips, 4 cores/chip |
| Hardware Threads: | 16 (2 / core) |
| CPU(s) Orderable: | 1,2 chips |
| Primary Cache: | 32 KB I + 32 KB D on chip per core |
| Secondary Cache: | 256 KB I+D on chip per core |
| Tertiary Cache: | 8 MB I+D on chip per chip |
| Other Cache: | None |
| Memory Amount (GB): | 8 |
| # and size of DIMM: | 4 x 2048 MB |
| Memory Details: | 2GB 2Rx8 PC3-10600E ECC CL9; slots B1, C1, E1, F1 populated |
| Power Supply Quantity and Rating (W): | 1 x 400 |
| Power Supply Details: | Fujitsu Technology Solutions DPS-460GP A |
| Disk Drive: | 1 x 160GB HDD SATA (2.5", 5.4krpm) |
| Disk Controller: | Integrated SATA Controller |
| # and type of Network Interface Cards (NICs) Installed: | 2 x Intel 82576 Gigabit Network Connection (onboard) |
| NICs Enabled in Firmware / OS / Connected: | 2/1/1 |
| Network Speed (Mbit): | 1000 |
| Keyboard: | None |
| Mouse: | None |
| Monitor: | None |
| Optical Drives: | No |
| Other Hardware: | None |
| Software | |
|---|---|
| Power Management: | Enabled ("Fujitsu Enhanced Power Settings" power plan) |
| Operating System (OS): | Microsoft Windows Server 2008 R2 Enterprise |
| OS Version: | Version 6.1.7600 Build 7600 |
| Filesystem: | NTFS |
| JVM Vendor: | IBM Corporation |
| JVM Version: | IBM J9 VM (build 2.4, JRE 1.6.0 IBM J9 2.4 Windows Server 2008 amd64-64 jvmwa6460sr6-20090923_42924 (JIT enabled, AOT enabled) |
| JVM Command-line Options: | -Xaggressive -Xcompressedrefs -Xgcpolicy:gencon -Xmn1400m -Xms1550m -Xmx1550m -XlockReservation -Xnoloa -XtlhPrefetch -Xlp -Xgcthreads4 |
| JVM Affinity: | start /affinity [0x000F,0x00F0,0x0F00,0xF000] |
| JVM Instances: | 4 |
| JVM Initial Heap (MB): | 1550 |
| JVM Maximum Heap (MB): | 1550 |
| JVM Address Bits: | 64 |
| Boot Firmware Version: | 0.46 |
| Management Firmware Version: | 0.48 |
| Workload Version: | SSJ 1.2.6 |
| Director Location: | Controller |
| Other Software: | None |
| JVM Instance | ssj_ops@100% |
|---|---|
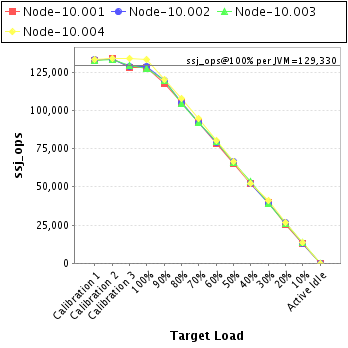
| Node-10.001 | 128,296 |
| Node-10.002 | 128,531 |
| Node-10.003 | 127,391 |
| Node-10.004 | 133,101 |
| ssj_ops@100% | 517,318 |
| ssj_ops@100% per JVM | 129,330 |
| Target Load | Actual Load | ssj_ops | |
|---|---|---|---|
| Target | Actual | ||
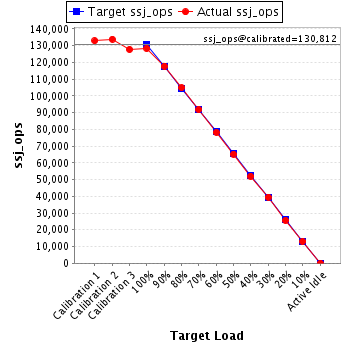
| Calibration 1 | 132,863 | ||
| Calibration 2 | 133,879 | ||
| Calibration 3 | 127,745 | ||
| ssj_ops@calibrated=130,812 | |||
| 100% | 98.1% | 130,812 | 128,296 |
| 90% | 90.1% | 117,731 | 117,808 |
| 80% | 80.2% | 104,650 | 104,882 |
| 70% | 70.2% | 91,569 | 91,836 |
| 60% | 59.8% | 78,487 | 78,188 |
| 50% | 49.9% | 65,406 | 65,268 |
| 40% | 39.7% | 52,325 | 51,981 |
| 30% | 30.2% | 39,244 | 39,484 |
| 20% | 19.6% | 26,162 | 25,657 |
| 10% | 10.0% | 13,081 | 13,095 |
| Active Idle | 0 | 0 | |
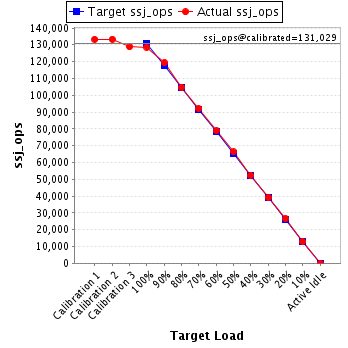
| Target Load | Actual Load | ssj_ops | |
|---|---|---|---|
| Target | Actual | ||
| Calibration 1 | 133,249 | ||
| Calibration 2 | 133,357 | ||
| Calibration 3 | 128,700 | ||
| ssj_ops@calibrated=131,029 | |||
| 100% | 98.1% | 131,029 | 128,531 |
| 90% | 91.1% | 117,926 | 119,409 |
| 80% | 80.0% | 104,823 | 104,846 |
| 70% | 70.2% | 91,720 | 92,043 |
| 60% | 60.2% | 78,617 | 78,899 |
| 50% | 50.6% | 65,514 | 66,240 |
| 40% | 40.0% | 52,412 | 52,449 |
| 30% | 29.9% | 39,309 | 39,232 |
| 20% | 20.2% | 26,206 | 26,484 |
| 10% | 9.9% | 13,103 | 12,937 |
| Active Idle | 0 | 0 | |
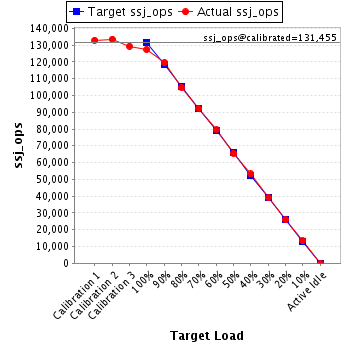
| Target Load | Actual Load | ssj_ops | |
|---|---|---|---|
| Target | Actual | ||
| Calibration 1 | 132,870 | ||
| Calibration 2 | 133,538 | ||
| Calibration 3 | 129,372 | ||
| ssj_ops@calibrated=131,455 | |||
| 100% | 96.9% | 131,455 | 127,391 |
| 90% | 90.9% | 118,310 | 119,489 |
| 80% | 79.6% | 105,164 | 104,702 |
| 70% | 70.2% | 92,019 | 92,336 |
| 60% | 60.5% | 78,873 | 79,490 |
| 50% | 50.0% | 65,728 | 65,700 |
| 40% | 40.5% | 52,582 | 53,221 |
| 30% | 29.8% | 39,437 | 39,215 |
| 20% | 19.7% | 26,291 | 25,950 |
| 10% | 10.1% | 13,146 | 13,283 |
| Active Idle | 0 | 0 | |
| Target Load | Actual Load | ssj_ops | |
|---|---|---|---|
| Target | Actual | ||
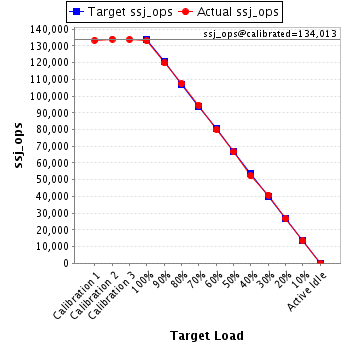
| Calibration 1 | 133,427 | ||
| Calibration 2 | 134,081 | ||
| Calibration 3 | 133,944 | ||
| ssj_ops@calibrated=134,013 | |||
| 100% | 99.3% | 134,013 | 133,101 |
| 90% | 89.5% | 120,611 | 119,923 |
| 80% | 80.2% | 107,210 | 107,464 |
| 70% | 70.6% | 93,809 | 94,559 |
| 60% | 59.8% | 80,408 | 80,129 |
| 50% | 49.7% | 67,006 | 66,585 |
| 40% | 39.0% | 53,605 | 52,234 |
| 30% | 30.5% | 40,204 | 40,835 |
| 20% | 19.9% | 26,803 | 26,645 |
| 10% | 10.0% | 13,401 | 13,353 |
| Active Idle | 0 | 0 | |