SPECpower_ssj2008
Host 'Node-14' Performance Report
Copyright © 2007-2010 Standard Performance Evaluation Corporation
| Fujitsu PRIMERGY CX120 S1 (Intel Xeon L5530) | ssj_ops@100% = 527,478 ssj_ops@100% per JVM = 131,870 |
||||
| Test Sponsor: | Fujitsu | SPEC License #: | 19 | Test Method: | Multi Node |
| Tested By: | Fujitsu | Test Location: | Paderborn, NRW, Germany | Test Date: | Mar 7, 2010 |
| Hardware Availability: | Jun-2010 | Software Availability: | Nov-2009 | Publication: | Mar 24, 2010 |
| System Source: | Single Supplier | System Designation: | Server | Power Provisioning: | Line-powered |
| Target Load | Actual Load | ssj_ops | |
|---|---|---|---|
| Target | Actual | ||
| Calibration 1 | 530,596 | ||
| Calibration 2 | 532,365 | ||
| Calibration 3 | 529,998 | ||
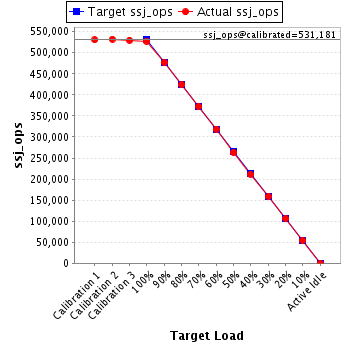
| ssj_ops@calibrated=531,181 | |||
| 100% | 99.3% | 531,181 | 527,478 |
| 90% | 89.8% | 478,063 | 476,987 |
| 80% | 79.8% | 424,945 | 424,132 |
| 70% | 70.0% | 371,827 | 372,018 |
| 60% | 60.0% | 318,709 | 318,940 |
| 50% | 49.5% | 265,591 | 263,001 |
| 40% | 39.8% | 212,472 | 211,330 |
| 30% | 29.9% | 159,354 | 158,951 |
| 20% | 19.9% | 106,236 | 105,893 |
| 10% | 10.2% | 53,118 | 54,347 |
| Active Idle | 0 | 0 | |
| Set Identifier: | SUT |
| Set Description: | Set of 38 identically configured PRIMERGY CX120 S1 servers |
| # of Identical Nodes: | 38 |
| Comment: | None |
| Hardware | |
|---|---|
| Hardware Vendor: | Fujitsu |
| Model: | PRIMERGY CX120 S1 (Intel Xeon L5530) |
| Form Factor: | 1U |
| CPU Name: | Intel Xeon L5530 |
| CPU Characteristics: | Quad-Core, 2.40GHz, 8MB L3 Cache |
| CPU Frequency (MHz): | 2400 |
| CPU(s) Enabled: | 8 cores, 2 chips, 4 cores/chip |
| Hardware Threads: | 16 (2 / core) |
| CPU(s) Orderable: | 1,2 chips |
| Primary Cache: | 32 KB I + 32 KB D on chip per core |
| Secondary Cache: | 256 KB I+D on chip per core |
| Tertiary Cache: | 8 MB I+D on chip per chip |
| Other Cache: | None |
| Memory Amount (GB): | 8 |
| # and size of DIMM: | 4 x 2048 MB |
| Memory Details: | 2GB 2Rx8 PC3-10600E ECC CL9; slots B1, C1, E1, F1 populated |
| Power Supply Quantity and Rating (W): | 1 x 400 |
| Power Supply Details: | Fujitsu Technology Solutions DPS-460GP A |
| Disk Drive: | 1 x 160GB HDD SATA (2.5", 5.4krpm) |
| Disk Controller: | Integrated SATA Controller |
| # and type of Network Interface Cards (NICs) Installed: | 2 x Intel 82576 Gigabit Network Connection (onboard) |
| NICs Enabled in Firmware / OS / Connected: | 2/1/1 |
| Network Speed (Mbit): | 1000 |
| Keyboard: | None |
| Mouse: | None |
| Monitor: | None |
| Optical Drives: | No |
| Other Hardware: | None |
| Software | |
|---|---|
| Power Management: | Enabled ("Fujitsu Enhanced Power Settings" power plan) |
| Operating System (OS): | Microsoft Windows Server 2008 R2 Enterprise |
| OS Version: | Version 6.1.7600 Build 7600 |
| Filesystem: | NTFS |
| JVM Vendor: | IBM Corporation |
| JVM Version: | IBM J9 VM (build 2.4, JRE 1.6.0 IBM J9 2.4 Windows Server 2008 amd64-64 jvmwa6460sr6-20090923_42924 (JIT enabled, AOT enabled) |
| JVM Command-line Options: | -Xaggressive -Xcompressedrefs -Xgcpolicy:gencon -Xmn1400m -Xms1550m -Xmx1550m -XlockReservation -Xnoloa -XtlhPrefetch -Xlp -Xgcthreads4 |
| JVM Affinity: | start /affinity [0x000F,0x00F0,0x0F00,0xF000] |
| JVM Instances: | 4 |
| JVM Initial Heap (MB): | 1550 |
| JVM Maximum Heap (MB): | 1550 |
| JVM Address Bits: | 64 |
| Boot Firmware Version: | 0.46 |
| Management Firmware Version: | 0.48 |
| Workload Version: | SSJ 1.2.6 |
| Director Location: | Controller |
| Other Software: | None |
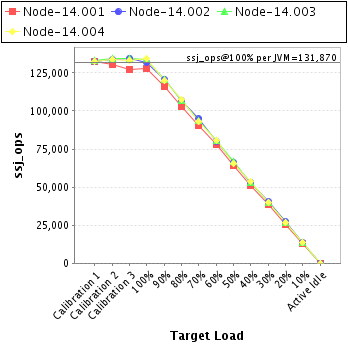
| JVM Instance | ssj_ops@100% |
|---|---|
| Node-14.001 | 127,703 |
| Node-14.002 | 131,822 |
| Node-14.003 | 133,789 |
| Node-14.004 | 134,164 |
| ssj_ops@100% | 527,478 |
| ssj_ops@100% per JVM | 131,870 |
| Target Load | Actual Load | ssj_ops | |
|---|---|---|---|
| Target | Actual | ||
| Calibration 1 | 132,350 | ||
| Calibration 2 | 130,525 | ||
| Calibration 3 | 127,463 | ||
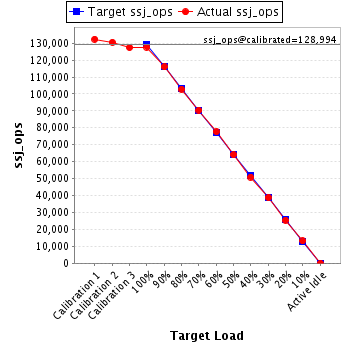
| ssj_ops@calibrated=128,994 | |||
| 100% | 99.0% | 128,994 | 127,703 |
| 90% | 89.9% | 116,095 | 115,980 |
| 80% | 79.7% | 103,195 | 102,845 |
| 70% | 70.1% | 90,296 | 90,467 |
| 60% | 60.2% | 77,397 | 77,694 |
| 50% | 49.6% | 64,497 | 64,029 |
| 40% | 39.5% | 51,598 | 50,941 |
| 30% | 30.1% | 38,698 | 38,797 |
| 20% | 19.7% | 25,799 | 25,476 |
| 10% | 10.2% | 12,899 | 13,157 |
| Active Idle | 0 | 0 | |
| Target Load | Actual Load | ssj_ops | |
|---|---|---|---|
| Target | Actual | ||
| Calibration 1 | 132,482 | ||
| Calibration 2 | 133,651 | ||
| Calibration 3 | 134,654 | ||
| ssj_ops@calibrated=134,152 | |||
| 100% | 98.3% | 134,152 | 131,822 |
| 90% | 90.0% | 120,737 | 120,732 |
| 80% | 79.6% | 107,322 | 106,840 |
| 70% | 70.7% | 93,907 | 94,818 |
| 60% | 59.8% | 80,491 | 80,191 |
| 50% | 49.4% | 67,076 | 66,260 |
| 40% | 39.8% | 53,661 | 53,338 |
| 30% | 30.1% | 40,246 | 40,382 |
| 20% | 20.3% | 26,830 | 27,201 |
| 10% | 10.1% | 13,415 | 13,616 |
| Active Idle | 0 | 0 | |

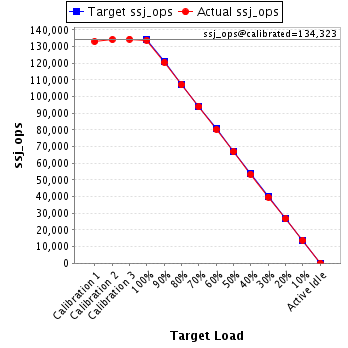
| Target Load | Actual Load | ssj_ops | |
|---|---|---|---|
| Target | Actual | ||
| Calibration 1 | 133,023 | ||
| Calibration 2 | 134,201 | ||
| Calibration 3 | 134,445 | ||
| ssj_ops@calibrated=134,323 | |||
| 100% | 99.6% | 134,323 | 133,789 |
| 90% | 89.7% | 120,891 | 120,515 |
| 80% | 79.7% | 107,458 | 107,056 |
| 70% | 69.9% | 94,026 | 93,879 |
| 60% | 59.8% | 80,594 | 80,355 |
| 50% | 49.8% | 67,161 | 66,925 |
| 40% | 39.7% | 53,729 | 53,316 |
| 30% | 29.6% | 40,297 | 39,752 |
| 20% | 19.8% | 26,865 | 26,612 |
| 10% | 10.3% | 13,432 | 13,782 |
| Active Idle | 0 | 0 | |
| Target Load | Actual Load | ssj_ops | |
|---|---|---|---|
| Target | Actual | ||
| Calibration 1 | 132,741 | ||
| Calibration 2 | 133,988 | ||
| Calibration 3 | 133,436 | ||
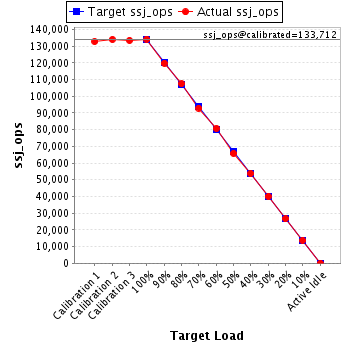
| ssj_ops@calibrated=133,712 | |||
| 100% | 100.3% | 133,712 | 134,164 |
| 90% | 89.6% | 120,341 | 119,759 |
| 80% | 80.3% | 106,969 | 107,392 |
| 70% | 69.4% | 93,598 | 92,854 |
| 60% | 60.4% | 80,227 | 80,701 |
| 50% | 49.2% | 66,856 | 65,786 |
| 40% | 40.2% | 53,485 | 53,736 |
| 30% | 29.9% | 40,114 | 40,020 |
| 20% | 19.9% | 26,742 | 26,604 |
| 10% | 10.3% | 13,371 | 13,791 |
| Active Idle | 0 | 0 | |