
SPECpower_ssj2008
Host 'Node-15' Performance Report
Copyright © 2007-2010 Standard Performance Evaluation Corporation
| Fujitsu PRIMERGY CX120 S1 (Intel Xeon L5530) | ssj_ops@100% = 518,125 ssj_ops@100% per JVM = 129,531 |
||||
| Test Sponsor: | Fujitsu | SPEC License #: | 19 | Test Method: | Multi Node |
| Tested By: | Fujitsu | Test Location: | Paderborn, NRW, Germany | Test Date: | Mar 7, 2010 |
| Hardware Availability: | Jun-2010 | Software Availability: | Nov-2009 | Publication: | Mar 24, 2010 |
| System Source: | Single Supplier | System Designation: | Server | Power Provisioning: | Line-powered |
| Target Load | Actual Load | ssj_ops | |
|---|---|---|---|
| Target | Actual | ||
| Calibration 1 | 527,389 | ||
| Calibration 2 | 525,873 | ||
| Calibration 3 | 520,650 | ||
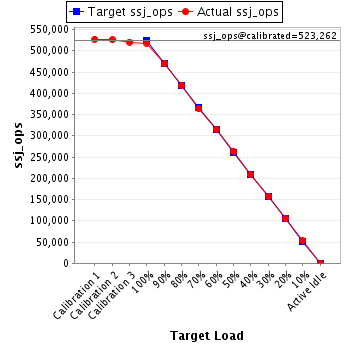
| ssj_ops@calibrated=523,262 | |||
| 100% | 99.0% | 523,262 | 518,125 |
| 90% | 89.9% | 470,935 | 470,188 |
| 80% | 79.8% | 418,609 | 417,320 |
| 70% | 69.5% | 366,283 | 363,592 |
| 60% | 60.3% | 313,957 | 315,785 |
| 50% | 50.4% | 261,631 | 263,959 |
| 40% | 39.8% | 209,305 | 208,445 |
| 30% | 30.2% | 156,978 | 158,128 |
| 20% | 20.0% | 104,652 | 104,721 |
| 10% | 10.1% | 52,326 | 52,706 |
| Active Idle | 0 | 0 | |
| Set Identifier: | SUT |
| Set Description: | Set of 38 identically configured PRIMERGY CX120 S1 servers |
| # of Identical Nodes: | 38 |
| Comment: | None |
| Hardware | |
|---|---|
| Hardware Vendor: | Fujitsu |
| Model: | PRIMERGY CX120 S1 (Intel Xeon L5530) |
| Form Factor: | 1U |
| CPU Name: | Intel Xeon L5530 |
| CPU Characteristics: | Quad-Core, 2.40GHz, 8MB L3 Cache |
| CPU Frequency (MHz): | 2400 |
| CPU(s) Enabled: | 8 cores, 2 chips, 4 cores/chip |
| Hardware Threads: | 16 (2 / core) |
| CPU(s) Orderable: | 1,2 chips |
| Primary Cache: | 32 KB I + 32 KB D on chip per core |
| Secondary Cache: | 256 KB I+D on chip per core |
| Tertiary Cache: | 8 MB I+D on chip per chip |
| Other Cache: | None |
| Memory Amount (GB): | 8 |
| # and size of DIMM: | 4 x 2048 MB |
| Memory Details: | 2GB 2Rx8 PC3-10600E ECC CL9; slots B1, C1, E1, F1 populated |
| Power Supply Quantity and Rating (W): | 1 x 400 |
| Power Supply Details: | Fujitsu Technology Solutions DPS-460GP A |
| Disk Drive: | 1 x 160GB HDD SATA (2.5", 5.4krpm) |
| Disk Controller: | Integrated SATA Controller |
| # and type of Network Interface Cards (NICs) Installed: | 2 x Intel 82576 Gigabit Network Connection (onboard) |
| NICs Enabled in Firmware / OS / Connected: | 2/1/1 |
| Network Speed (Mbit): | 1000 |
| Keyboard: | None |
| Mouse: | None |
| Monitor: | None |
| Optical Drives: | No |
| Other Hardware: | None |
| Software | |
|---|---|
| Power Management: | Enabled ("Fujitsu Enhanced Power Settings" power plan) |
| Operating System (OS): | Microsoft Windows Server 2008 R2 Enterprise |
| OS Version: | Version 6.1.7600 Build 7600 |
| Filesystem: | NTFS |
| JVM Vendor: | IBM Corporation |
| JVM Version: | IBM J9 VM (build 2.4, JRE 1.6.0 IBM J9 2.4 Windows Server 2008 amd64-64 jvmwa6460sr6-20090923_42924 (JIT enabled, AOT enabled) |
| JVM Command-line Options: | -Xaggressive -Xcompressedrefs -Xgcpolicy:gencon -Xmn1400m -Xms1550m -Xmx1550m -XlockReservation -Xnoloa -XtlhPrefetch -Xlp -Xgcthreads4 |
| JVM Affinity: | start /affinity [0x000F,0x00F0,0x0F00,0xF000] |
| JVM Instances: | 4 |
| JVM Initial Heap (MB): | 1550 |
| JVM Maximum Heap (MB): | 1550 |
| JVM Address Bits: | 64 |
| Boot Firmware Version: | 0.46 |
| Management Firmware Version: | 0.48 |
| Workload Version: | SSJ 1.2.6 |
| Director Location: | Controller |
| Other Software: | None |
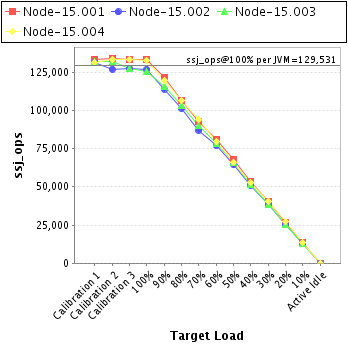
| JVM Instance | ssj_ops@100% |
|---|---|
| Node-15.001 | 133,124 |
| Node-15.002 | 126,693 |
| Node-15.003 | 125,610 |
| Node-15.004 | 132,698 |
| ssj_ops@100% | 518,125 |
| ssj_ops@100% per JVM | 129,531 |
| Target Load | Actual Load | ssj_ops | |
|---|---|---|---|
| Target | Actual | ||
| Calibration 1 | 133,486 | ||
| Calibration 2 | 134,101 | ||
| Calibration 3 | 133,375 | ||
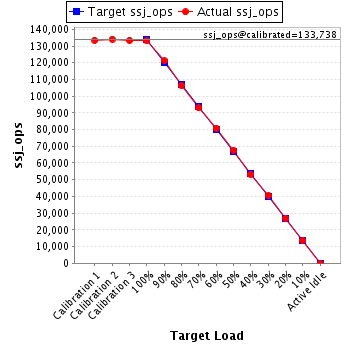
| ssj_ops@calibrated=133,738 | |||
| 100% | 99.5% | 133,738 | 133,124 |
| 90% | 90.6% | 120,364 | 121,153 |
| 80% | 79.5% | 106,991 | 106,284 |
| 70% | 69.5% | 93,617 | 92,951 |
| 60% | 60.4% | 80,243 | 80,838 |
| 50% | 50.6% | 66,869 | 67,730 |
| 40% | 39.9% | 53,495 | 53,296 |
| 30% | 30.2% | 40,121 | 40,397 |
| 20% | 20.1% | 26,748 | 26,870 |
| 10% | 10.2% | 13,374 | 13,628 |
| Active Idle | 0 | 0 | |
| Target Load | Actual Load | ssj_ops | |
|---|---|---|---|
| Target | Actual | ||
| Calibration 1 | 131,071 | ||
| Calibration 2 | 126,954 | ||
| Calibration 3 | 127,048 | ||
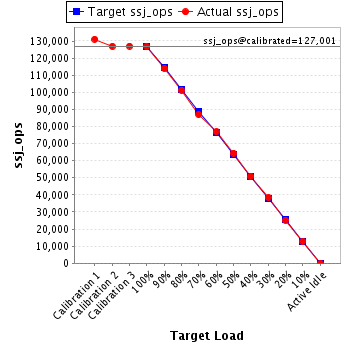
| ssj_ops@calibrated=127,001 | |||
| 100% | 99.8% | 127,001 | 126,693 |
| 90% | 89.7% | 114,301 | 113,924 |
| 80% | 79.7% | 101,601 | 101,281 |
| 70% | 68.5% | 88,901 | 87,036 |
| 60% | 60.5% | 76,201 | 76,833 |
| 50% | 50.7% | 63,501 | 64,415 |
| 40% | 40.1% | 50,800 | 50,984 |
| 30% | 30.2% | 38,100 | 38,366 |
| 20% | 19.8% | 25,400 | 25,209 |
| 10% | 10.2% | 12,700 | 12,945 |
| Active Idle | 0 | 0 | |
| Target Load | Actual Load | ssj_ops | |
|---|---|---|---|
| Target | Actual | ||
| Calibration 1 | 131,682 | ||
| Calibration 2 | 131,750 | ||
| Calibration 3 | 127,154 | ||
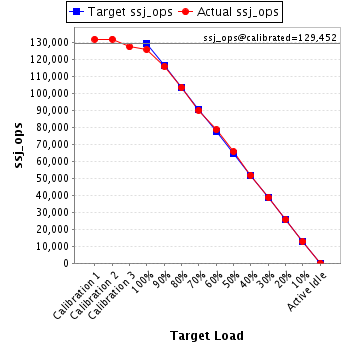
| ssj_ops@calibrated=129,452 | |||
| 100% | 97.0% | 129,452 | 125,610 |
| 90% | 89.4% | 116,506 | 115,670 |
| 80% | 79.8% | 103,561 | 103,308 |
| 70% | 69.4% | 90,616 | 89,851 |
| 60% | 60.7% | 77,671 | 78,563 |
| 50% | 50.7% | 64,726 | 65,614 |
| 40% | 39.9% | 51,781 | 51,647 |
| 30% | 29.9% | 38,835 | 38,689 |
| 20% | 19.8% | 25,890 | 25,575 |
| 10% | 9.9% | 12,945 | 12,817 |
| Active Idle | 0 | 0 | |
| Target Load | Actual Load | ssj_ops | |
|---|---|---|---|
| Target | Actual | ||
| Calibration 1 | 131,149 | ||
| Calibration 2 | 133,068 | ||
| Calibration 3 | 133,073 | ||
| ssj_ops@calibrated=133,071 | |||
| 100% | 99.7% | 133,071 | 132,698 |
| 90% | 89.8% | 119,764 | 119,441 |
| 80% | 80.0% | 106,456 | 106,446 |
| 70% | 70.5% | 93,149 | 93,754 |
| 60% | 59.8% | 79,842 | 79,552 |
| 50% | 49.7% | 66,535 | 66,199 |
| 40% | 39.5% | 53,228 | 52,519 |
| 30% | 30.6% | 39,921 | 40,676 |
| 20% | 20.3% | 26,614 | 27,068 |
| 10% | 10.0% | 13,307 | 13,316 |
| Active Idle | 0 | 0 | |
