SPECpower_ssj2008
Host 'Node-18' Performance Report
Copyright © 2007-2010 Standard Performance Evaluation Corporation
| Fujitsu PRIMERGY CX120 S1 (Intel Xeon L5530) | ssj_ops@100% = 519,584 ssj_ops@100% per JVM = 129,896 |
||||
| Test Sponsor: | Fujitsu | SPEC License #: | 19 | Test Method: | Multi Node |
| Tested By: | Fujitsu | Test Location: | Paderborn, NRW, Germany | Test Date: | Mar 7, 2010 |
| Hardware Availability: | Jun-2010 | Software Availability: | Nov-2009 | Publication: | Mar 24, 2010 |
| System Source: | Single Supplier | System Designation: | Server | Power Provisioning: | Line-powered |
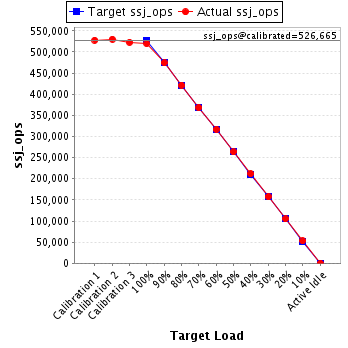
| Target Load | Actual Load | ssj_ops | |
|---|---|---|---|
| Target | Actual | ||
| Calibration 1 | 528,174 | ||
| Calibration 2 | 530,325 | ||
| Calibration 3 | 523,005 | ||
| ssj_ops@calibrated=526,665 | |||
| 100% | 98.7% | 526,665 | 519,584 |
| 90% | 90.0% | 473,999 | 474,229 |
| 80% | 80.1% | 421,332 | 421,666 |
| 70% | 69.9% | 368,666 | 368,305 |
| 60% | 60.2% | 315,999 | 317,140 |
| 50% | 50.0% | 263,333 | 263,322 |
| 40% | 40.2% | 210,666 | 211,732 |
| 30% | 29.9% | 158,000 | 157,516 |
| 20% | 19.9% | 105,333 | 104,797 |
| 10% | 10.0% | 52,667 | 52,727 |
| Active Idle | 0 | 0 | |
| Set Identifier: | SUT |
| Set Description: | Set of 38 identically configured PRIMERGY CX120 S1 servers |
| # of Identical Nodes: | 38 |
| Comment: | None |
| Hardware | |
|---|---|
| Hardware Vendor: | Fujitsu |
| Model: | PRIMERGY CX120 S1 (Intel Xeon L5530) |
| Form Factor: | 1U |
| CPU Name: | Intel Xeon L5530 |
| CPU Characteristics: | Quad-Core, 2.40GHz, 8MB L3 Cache |
| CPU Frequency (MHz): | 2400 |
| CPU(s) Enabled: | 8 cores, 2 chips, 4 cores/chip |
| Hardware Threads: | 16 (2 / core) |
| CPU(s) Orderable: | 1,2 chips |
| Primary Cache: | 32 KB I + 32 KB D on chip per core |
| Secondary Cache: | 256 KB I+D on chip per core |
| Tertiary Cache: | 8 MB I+D on chip per chip |
| Other Cache: | None |
| Memory Amount (GB): | 8 |
| # and size of DIMM: | 4 x 2048 MB |
| Memory Details: | 2GB 2Rx8 PC3-10600E ECC CL9; slots B1, C1, E1, F1 populated |
| Power Supply Quantity and Rating (W): | 1 x 400 |
| Power Supply Details: | Fujitsu Technology Solutions DPS-460GP A |
| Disk Drive: | 1 x 160GB HDD SATA (2.5", 5.4krpm) |
| Disk Controller: | Integrated SATA Controller |
| # and type of Network Interface Cards (NICs) Installed: | 2 x Intel 82576 Gigabit Network Connection (onboard) |
| NICs Enabled in Firmware / OS / Connected: | 2/1/1 |
| Network Speed (Mbit): | 1000 |
| Keyboard: | None |
| Mouse: | None |
| Monitor: | None |
| Optical Drives: | No |
| Other Hardware: | None |
| Software | |
|---|---|
| Power Management: | Enabled ("Fujitsu Enhanced Power Settings" power plan) |
| Operating System (OS): | Microsoft Windows Server 2008 R2 Enterprise |
| OS Version: | Version 6.1.7600 Build 7600 |
| Filesystem: | NTFS |
| JVM Vendor: | IBM Corporation |
| JVM Version: | IBM J9 VM (build 2.4, JRE 1.6.0 IBM J9 2.4 Windows Server 2008 amd64-64 jvmwa6460sr6-20090923_42924 (JIT enabled, AOT enabled) |
| JVM Command-line Options: | -Xaggressive -Xcompressedrefs -Xgcpolicy:gencon -Xmn1400m -Xms1550m -Xmx1550m -XlockReservation -Xnoloa -XtlhPrefetch -Xlp -Xgcthreads4 |
| JVM Affinity: | start /affinity [0x000F,0x00F0,0x0F00,0xF000] |
| JVM Instances: | 4 |
| JVM Initial Heap (MB): | 1550 |
| JVM Maximum Heap (MB): | 1550 |
| JVM Address Bits: | 64 |
| Boot Firmware Version: | 0.46 |
| Management Firmware Version: | 0.48 |
| Workload Version: | SSJ 1.2.6 |
| Director Location: | Controller |
| Other Software: | None |
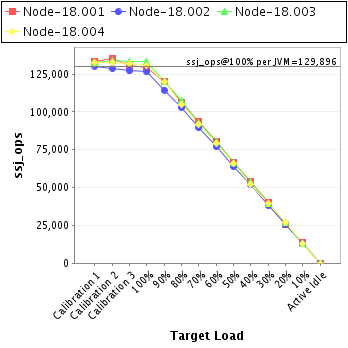
| JVM Instance | ssj_ops@100% |
|---|---|
| Node-18.001 | 129,190 |
| Node-18.002 | 126,369 |
| Node-18.003 | 133,064 |
| Node-18.004 | 130,960 |
| ssj_ops@100% | 519,584 |
| ssj_ops@100% per JVM | 129,896 |
| Target Load | Actual Load | ssj_ops | |
|---|---|---|---|
| Target | Actual | ||
| Calibration 1 | 133,193 | ||
| Calibration 2 | 135,482 | ||
| Calibration 3 | 130,750 | ||
| ssj_ops@calibrated=133,116 | |||
| 100% | 97.1% | 133,116 | 129,190 |
| 90% | 90.3% | 119,804 | 120,246 |
| 80% | 80.0% | 106,492 | 106,489 |
| 70% | 70.3% | 93,181 | 93,594 |
| 60% | 60.4% | 79,869 | 80,380 |
| 50% | 50.1% | 66,558 | 66,750 |
| 40% | 40.5% | 53,246 | 53,896 |
| 30% | 30.4% | 39,935 | 40,404 |
| 20% | 19.4% | 26,623 | 25,867 |
| 10% | 10.1% | 13,312 | 13,458 |
| Active Idle | 0 | 0 | |

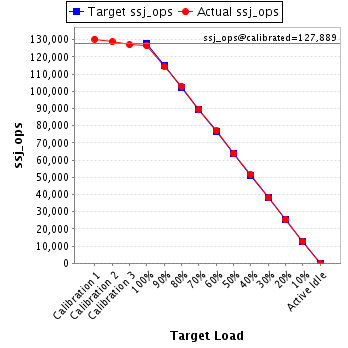
| Target Load | Actual Load | ssj_ops | |
|---|---|---|---|
| Target | Actual | ||
| Calibration 1 | 130,298 | ||
| Calibration 2 | 128,725 | ||
| Calibration 3 | 127,053 | ||
| ssj_ops@calibrated=127,889 | |||
| 100% | 98.8% | 127,889 | 126,369 |
| 90% | 89.4% | 115,100 | 114,344 |
| 80% | 80.5% | 102,311 | 102,963 |
| 70% | 70.1% | 89,522 | 89,603 |
| 60% | 60.2% | 76,733 | 76,979 |
| 50% | 50.0% | 63,945 | 63,972 |
| 40% | 40.4% | 51,156 | 51,711 |
| 30% | 29.8% | 38,367 | 38,108 |
| 20% | 19.9% | 25,578 | 25,454 |
| 10% | 10.1% | 12,789 | 12,925 |
| Active Idle | 0 | 0 | |
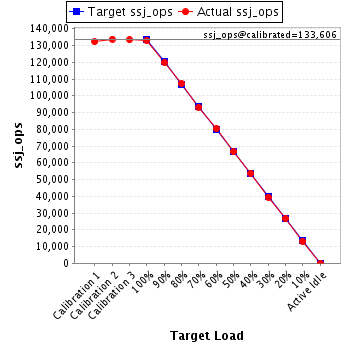
| Target Load | Actual Load | ssj_ops | |
|---|---|---|---|
| Target | Actual | ||
| Calibration 1 | 132,311 | ||
| Calibration 2 | 133,802 | ||
| Calibration 3 | 133,410 | ||
| ssj_ops@calibrated=133,606 | |||
| 100% | 99.6% | 133,606 | 133,064 |
| 90% | 89.7% | 120,245 | 119,863 |
| 80% | 80.3% | 106,885 | 107,343 |
| 70% | 69.8% | 93,524 | 93,270 |
| 60% | 60.1% | 80,164 | 80,359 |
| 50% | 49.8% | 66,803 | 66,563 |
| 40% | 40.3% | 53,442 | 53,851 |
| 30% | 29.5% | 40,082 | 39,470 |
| 20% | 20.1% | 26,721 | 26,825 |
| 10% | 9.8% | 13,361 | 13,125 |
| Active Idle | 0 | 0 | |
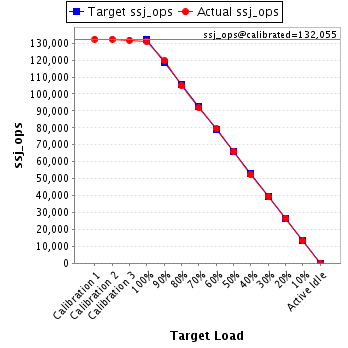
| Target Load | Actual Load | ssj_ops | |
|---|---|---|---|
| Target | Actual | ||
| Calibration 1 | 132,373 | ||
| Calibration 2 | 132,316 | ||
| Calibration 3 | 131,793 | ||
| ssj_ops@calibrated=132,055 | |||
| 100% | 99.2% | 132,055 | 130,960 |
| 90% | 90.7% | 118,849 | 119,776 |
| 80% | 79.4% | 105,644 | 104,870 |
| 70% | 69.5% | 92,438 | 91,838 |
| 60% | 60.1% | 79,233 | 79,422 |
| 50% | 50.0% | 66,027 | 66,038 |
| 40% | 39.6% | 52,822 | 52,274 |
| 30% | 29.9% | 39,616 | 39,534 |
| 20% | 20.2% | 26,411 | 26,652 |
| 10% | 10.0% | 13,205 | 13,219 |
| Active Idle | 0 | 0 | |