
SPECpower_ssj2008
Host 'Node-2' Performance Report
Copyright © 2007-2010 Standard Performance Evaluation Corporation
| Fujitsu PRIMERGY CX120 S1 (Intel Xeon L5530) | ssj_ops@100% = 522,034 ssj_ops@100% per JVM = 130,508 |
||||
| Test Sponsor: | Fujitsu | SPEC License #: | 19 | Test Method: | Multi Node |
| Tested By: | Fujitsu | Test Location: | Paderborn, NRW, Germany | Test Date: | Mar 7, 2010 |
| Hardware Availability: | Jun-2010 | Software Availability: | Nov-2009 | Publication: | Mar 24, 2010 |
| System Source: | Single Supplier | System Designation: | Server | Power Provisioning: | Line-powered |
| Target Load | Actual Load | ssj_ops | |
|---|---|---|---|
| Target | Actual | ||
| Calibration 1 | 524,577 | ||
| Calibration 2 | 526,898 | ||
| Calibration 3 | 526,432 | ||
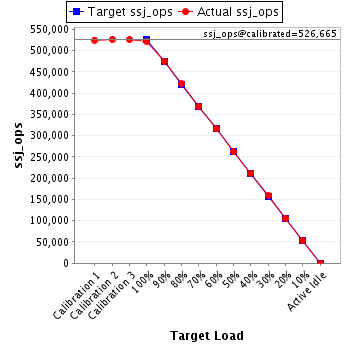
| ssj_ops@calibrated=526,665 | |||
| 100% | 99.1% | 526,665 | 522,034 |
| 90% | 90.2% | 473,999 | 475,171 |
| 80% | 80.1% | 421,332 | 421,895 |
| 70% | 70.2% | 368,666 | 369,574 |
| 60% | 60.0% | 315,999 | 315,812 |
| 50% | 49.8% | 263,333 | 262,536 |
| 40% | 40.2% | 210,666 | 211,802 |
| 30% | 30.2% | 158,000 | 158,834 |
| 20% | 20.1% | 105,333 | 105,731 |
| 10% | 10.1% | 52,667 | 53,068 |
| Active Idle | 0 | 0 | |
| Set Identifier: | SUT |
| Set Description: | Set of 38 identically configured PRIMERGY CX120 S1 servers |
| # of Identical Nodes: | 38 |
| Comment: | None |
| Hardware | |
|---|---|
| Hardware Vendor: | Fujitsu |
| Model: | PRIMERGY CX120 S1 (Intel Xeon L5530) |
| Form Factor: | 1U |
| CPU Name: | Intel Xeon L5530 |
| CPU Characteristics: | Quad-Core, 2.40GHz, 8MB L3 Cache |
| CPU Frequency (MHz): | 2400 |
| CPU(s) Enabled: | 8 cores, 2 chips, 4 cores/chip |
| Hardware Threads: | 16 (2 / core) |
| CPU(s) Orderable: | 1,2 chips |
| Primary Cache: | 32 KB I + 32 KB D on chip per core |
| Secondary Cache: | 256 KB I+D on chip per core |
| Tertiary Cache: | 8 MB I+D on chip per chip |
| Other Cache: | None |
| Memory Amount (GB): | 8 |
| # and size of DIMM: | 4 x 2048 MB |
| Memory Details: | 2GB 2Rx8 PC3-10600E ECC CL9; slots B1, C1, E1, F1 populated |
| Power Supply Quantity and Rating (W): | 1 x 400 |
| Power Supply Details: | Fujitsu Technology Solutions DPS-460GP A |
| Disk Drive: | 1 x 160GB HDD SATA (2.5", 5.4krpm) |
| Disk Controller: | Integrated SATA Controller |
| # and type of Network Interface Cards (NICs) Installed: | 2 x Intel 82576 Gigabit Network Connection (onboard) |
| NICs Enabled in Firmware / OS / Connected: | 2/1/1 |
| Network Speed (Mbit): | 1000 |
| Keyboard: | None |
| Mouse: | None |
| Monitor: | None |
| Optical Drives: | No |
| Other Hardware: | None |
| Software | |
|---|---|
| Power Management: | Enabled ("Fujitsu Enhanced Power Settings" power plan) |
| Operating System (OS): | Microsoft Windows Server 2008 R2 Enterprise |
| OS Version: | Version 6.1.7600 Build 7600 |
| Filesystem: | NTFS |
| JVM Vendor: | IBM Corporation |
| JVM Version: | IBM J9 VM (build 2.4, JRE 1.6.0 IBM J9 2.4 Windows Server 2008 amd64-64 jvmwa6460sr6-20090923_42924 (JIT enabled, AOT enabled) |
| JVM Command-line Options: | -Xaggressive -Xcompressedrefs -Xgcpolicy:gencon -Xmn1400m -Xms1550m -Xmx1550m -XlockReservation -Xnoloa -XtlhPrefetch -Xlp -Xgcthreads4 |
| JVM Affinity: | start /affinity [0x000F,0x00F0,0x0F00,0xF000] |
| JVM Instances: | 4 |
| JVM Initial Heap (MB): | 1550 |
| JVM Maximum Heap (MB): | 1550 |
| JVM Address Bits: | 64 |
| Boot Firmware Version: | 0.46 |
| Management Firmware Version: | 0.48 |
| Workload Version: | SSJ 1.2.6 |
| Director Location: | Controller |
| Other Software: | None |
| JVM Instance | ssj_ops@100% |
|---|---|
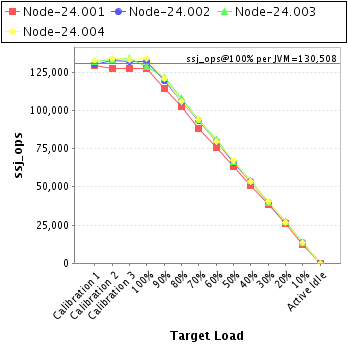
| Node-24.001 | 127,177 |
| Node-24.002 | 132,111 |
| Node-24.003 | 128,665 |
| Node-24.004 | 134,081 |
| ssj_ops@100% | 522,034 |
| ssj_ops@100% per JVM | 130,508 |
| Target Load | Actual Load | ssj_ops | |
|---|---|---|---|
| Target | Actual | ||
| Calibration 1 | 129,595 | ||
| Calibration 2 | 127,239 | ||
| Calibration 3 | 127,508 | ||
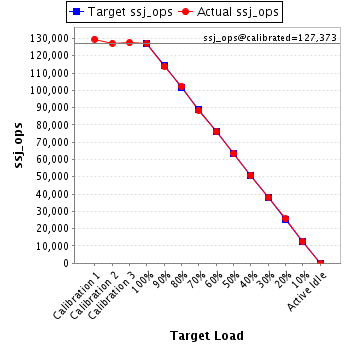
| ssj_ops@calibrated=127,373 | |||
| 100% | 99.8% | 127,373 | 127,177 |
| 90% | 89.5% | 114,636 | 114,030 |
| 80% | 80.3% | 101,899 | 102,300 |
| 70% | 69.4% | 89,161 | 88,402 |
| 60% | 59.6% | 76,424 | 75,953 |
| 50% | 49.8% | 63,687 | 63,393 |
| 40% | 40.0% | 50,949 | 50,955 |
| 30% | 30.0% | 38,212 | 38,244 |
| 20% | 20.2% | 25,475 | 25,704 |
| 10% | 9.8% | 12,737 | 12,530 |
| Active Idle | 0 | 0 | |
| Target Load | Actual Load | ssj_ops | |
|---|---|---|---|
| Target | Actual | ||
| Calibration 1 | 130,200 | ||
| Calibration 2 | 132,628 | ||
| Calibration 3 | 131,832 | ||
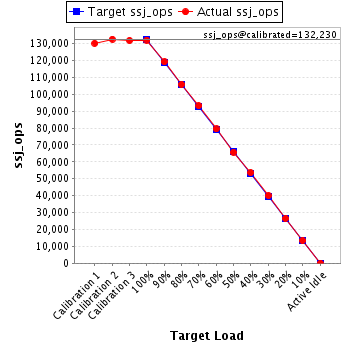
| ssj_ops@calibrated=132,230 | |||
| 100% | 99.9% | 132,230 | 132,111 |
| 90% | 90.1% | 119,007 | 119,187 |
| 80% | 80.1% | 105,784 | 105,892 |
| 70% | 70.5% | 92,561 | 93,203 |
| 60% | 60.1% | 79,338 | 79,495 |
| 50% | 49.7% | 66,115 | 65,747 |
| 40% | 40.5% | 52,892 | 53,608 |
| 30% | 30.3% | 39,669 | 40,018 |
| 20% | 20.1% | 26,446 | 26,565 |
| 10% | 10.2% | 13,223 | 13,471 |
| Active Idle | 0 | 0 | |
| Target Load | Actual Load | ssj_ops | |
|---|---|---|---|
| Target | Actual | ||
| Calibration 1 | 131,957 | ||
| Calibration 2 | 133,361 | ||
| Calibration 3 | 134,089 | ||
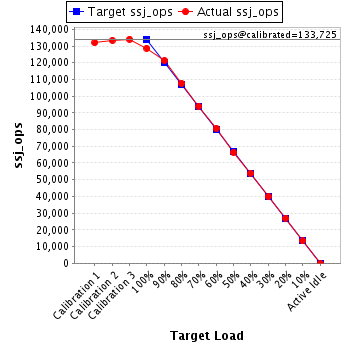
| ssj_ops@calibrated=133,725 | |||
| 100% | 96.2% | 133,725 | 128,665 |
| 90% | 90.7% | 120,353 | 121,338 |
| 80% | 80.5% | 106,980 | 107,681 |
| 70% | 70.3% | 93,608 | 94,027 |
| 60% | 60.3% | 80,235 | 80,688 |
| 50% | 49.7% | 66,863 | 66,409 |
| 40% | 40.4% | 53,490 | 53,971 |
| 30% | 29.9% | 40,118 | 39,950 |
| 20% | 20.2% | 26,745 | 27,051 |
| 10% | 10.0% | 13,373 | 13,333 |
| Active Idle | 0 | 0 | |
| Target Load | Actual Load | ssj_ops | |
|---|---|---|---|
| Target | Actual | ||
| Calibration 1 | 132,825 | ||
| Calibration 2 | 133,670 | ||
| Calibration 3 | 133,004 | ||
| ssj_ops@calibrated=133,337 | |||
| 100% | 100.6% | 133,337 | 134,081 |
| 90% | 90.5% | 120,003 | 120,616 |
| 80% | 79.5% | 106,669 | 106,021 |
| 70% | 70.5% | 93,336 | 93,941 |
| 60% | 59.8% | 80,002 | 79,677 |
| 50% | 50.2% | 66,668 | 66,987 |
| 40% | 39.9% | 53,335 | 53,267 |
| 30% | 30.5% | 40,001 | 40,623 |
| 20% | 19.8% | 26,667 | 26,411 |
| 10% | 10.3% | 13,334 | 13,733 |
| Active Idle | 0 | 0 | |
