SPECpower_ssj2008
Host 'Node-20' Performance Report
Copyright © 2007-2010 Standard Performance Evaluation Corporation
| Fujitsu PRIMERGY CX120 S1 (Intel Xeon L5530) | ssj_ops@100% = 515,500 ssj_ops@100% per JVM = 128,875 |
||||
| Test Sponsor: | Fujitsu | SPEC License #: | 19 | Test Method: | Multi Node |
| Tested By: | Fujitsu | Test Location: | Paderborn, NRW, Germany | Test Date: | Mar 7, 2010 |
| Hardware Availability: | Jun-2010 | Software Availability: | Nov-2009 | Publication: | Mar 24, 2010 |
| System Source: | Single Supplier | System Designation: | Server | Power Provisioning: | Line-powered |
| Target Load | Actual Load | ssj_ops | |
|---|---|---|---|
| Target | Actual | ||
| Calibration 1 | 522,765 | ||
| Calibration 2 | 521,279 | ||
| Calibration 3 | 517,594 | ||
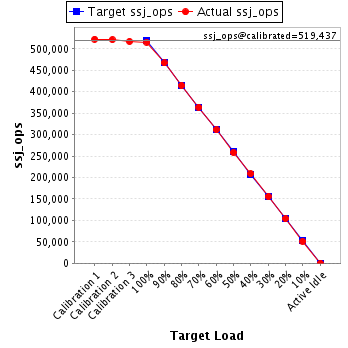
| ssj_ops@calibrated=519,437 | |||
| 100% | 99.2% | 519,437 | 515,500 |
| 90% | 89.9% | 467,493 | 467,208 |
| 80% | 79.8% | 415,549 | 414,715 |
| 70% | 70.1% | 363,606 | 363,939 |
| 60% | 60.0% | 311,662 | 311,533 |
| 50% | 49.8% | 259,718 | 258,509 |
| 40% | 40.2% | 207,775 | 208,900 |
| 30% | 30.0% | 155,831 | 155,762 |
| 20% | 20.0% | 103,887 | 103,950 |
| 10% | 9.9% | 51,944 | 51,309 |
| Active Idle | 0 | 0 | |
| Set Identifier: | SUT |
| Set Description: | Set of 38 identically configured PRIMERGY CX120 S1 servers |
| # of Identical Nodes: | 38 |
| Comment: | None |
| Hardware | |
|---|---|
| Hardware Vendor: | Fujitsu |
| Model: | PRIMERGY CX120 S1 (Intel Xeon L5530) |
| Form Factor: | 1U |
| CPU Name: | Intel Xeon L5530 |
| CPU Characteristics: | Quad-Core, 2.40GHz, 8MB L3 Cache |
| CPU Frequency (MHz): | 2400 |
| CPU(s) Enabled: | 8 cores, 2 chips, 4 cores/chip |
| Hardware Threads: | 16 (2 / core) |
| CPU(s) Orderable: | 1,2 chips |
| Primary Cache: | 32 KB I + 32 KB D on chip per core |
| Secondary Cache: | 256 KB I+D on chip per core |
| Tertiary Cache: | 8 MB I+D on chip per chip |
| Other Cache: | None |
| Memory Amount (GB): | 8 |
| # and size of DIMM: | 4 x 2048 MB |
| Memory Details: | 2GB 2Rx8 PC3-10600E ECC CL9; slots B1, C1, E1, F1 populated |
| Power Supply Quantity and Rating (W): | 1 x 400 |
| Power Supply Details: | Fujitsu Technology Solutions DPS-460GP A |
| Disk Drive: | 1 x 160GB HDD SATA (2.5", 5.4krpm) |
| Disk Controller: | Integrated SATA Controller |
| # and type of Network Interface Cards (NICs) Installed: | 2 x Intel 82576 Gigabit Network Connection (onboard) |
| NICs Enabled in Firmware / OS / Connected: | 2/1/1 |
| Network Speed (Mbit): | 1000 |
| Keyboard: | None |
| Mouse: | None |
| Monitor: | None |
| Optical Drives: | No |
| Other Hardware: | None |
| Software | |
|---|---|
| Power Management: | Enabled ("Fujitsu Enhanced Power Settings" power plan) |
| Operating System (OS): | Microsoft Windows Server 2008 R2 Enterprise |
| OS Version: | Version 6.1.7600 Build 7600 |
| Filesystem: | NTFS |
| JVM Vendor: | IBM Corporation |
| JVM Version: | IBM J9 VM (build 2.4, JRE 1.6.0 IBM J9 2.4 Windows Server 2008 amd64-64 jvmwa6460sr6-20090923_42924 (JIT enabled, AOT enabled) |
| JVM Command-line Options: | -Xaggressive -Xcompressedrefs -Xgcpolicy:gencon -Xmn1400m -Xms1550m -Xmx1550m -XlockReservation -Xnoloa -XtlhPrefetch -Xlp -Xgcthreads4 |
| JVM Affinity: | start /affinity [0x000F,0x00F0,0x0F00,0xF000] |
| JVM Instances: | 4 |
| JVM Initial Heap (MB): | 1550 |
| JVM Maximum Heap (MB): | 1550 |
| JVM Address Bits: | 64 |
| Boot Firmware Version: | 0.46 |
| Management Firmware Version: | 0.48 |
| Workload Version: | SSJ 1.2.6 |
| Director Location: | Controller |
| Other Software: | None |
| JVM Instance | ssj_ops@100% |
|---|---|
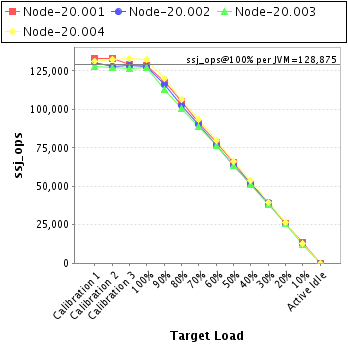
| Node-20.001 | 128,268 |
| Node-20.002 | 127,660 |
| Node-20.003 | 126,966 |
| Node-20.004 | 132,606 |
| ssj_ops@100% | 515,500 |
| ssj_ops@100% per JVM | 128,875 |
| Target Load | Actual Load | ssj_ops | |
|---|---|---|---|
| Target | Actual | ||
| Calibration 1 | 132,876 | ||
| Calibration 2 | 133,280 | ||
| Calibration 3 | 128,920 | ||
| ssj_ops@calibrated=131,100 | |||
| 100% | 97.8% | 131,100 | 128,268 |
| 90% | 89.9% | 117,990 | 117,886 |
| 80% | 80.2% | 104,880 | 105,087 |
| 70% | 69.7% | 91,770 | 91,410 |
| 60% | 60.1% | 78,660 | 78,734 |
| 50% | 49.7% | 65,550 | 65,221 |
| 40% | 39.7% | 52,440 | 52,108 |
| 30% | 29.6% | 39,330 | 38,816 |
| 20% | 19.7% | 26,220 | 25,858 |
| 10% | 10.1% | 13,110 | 13,178 |
| Active Idle | 0 | 0 | |

| Target Load | Actual Load | ssj_ops | |
|---|---|---|---|
| Target | Actual | ||
| Calibration 1 | 130,436 | ||
| Calibration 2 | 128,180 | ||
| Calibration 3 | 128,733 | ||
| ssj_ops@calibrated=128,456 | |||
| 100% | 99.4% | 128,456 | 127,660 |
| 90% | 90.2% | 115,611 | 115,855 |
| 80% | 79.8% | 102,765 | 102,549 |
| 70% | 70.3% | 89,920 | 90,279 |
| 60% | 59.7% | 77,074 | 76,666 |
| 50% | 49.2% | 64,228 | 63,231 |
| 40% | 40.3% | 51,383 | 51,726 |
| 30% | 30.5% | 38,537 | 39,190 |
| 20% | 20.1% | 25,691 | 25,824 |
| 10% | 10.0% | 12,846 | 12,820 |
| Active Idle | 0 | 0 | |

| Target Load | Actual Load | ssj_ops | |
|---|---|---|---|
| Target | Actual | ||
| Calibration 1 | 128,028 | ||
| Calibration 2 | 127,231 | ||
| Calibration 3 | 126,885 | ||
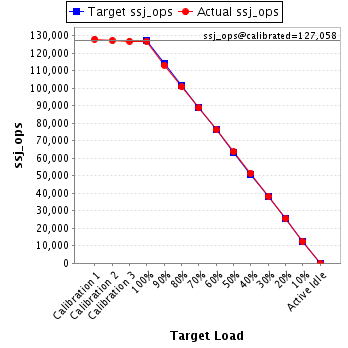
| ssj_ops@calibrated=127,058 | |||
| 100% | 99.9% | 127,058 | 126,966 |
| 90% | 89.1% | 114,352 | 113,237 |
| 80% | 79.3% | 101,646 | 100,765 |
| 70% | 69.8% | 88,941 | 88,709 |
| 60% | 60.0% | 76,235 | 76,269 |
| 50% | 50.1% | 63,529 | 63,692 |
| 40% | 40.5% | 50,823 | 51,474 |
| 30% | 30.0% | 38,117 | 38,108 |
| 20% | 20.1% | 25,412 | 25,558 |
| 10% | 9.8% | 12,706 | 12,428 |
| Active Idle | 0 | 0 | |
| Target Load | Actual Load | ssj_ops | |
|---|---|---|---|
| Target | Actual | ||
| Calibration 1 | 131,425 | ||
| Calibration 2 | 132,588 | ||
| Calibration 3 | 133,056 | ||
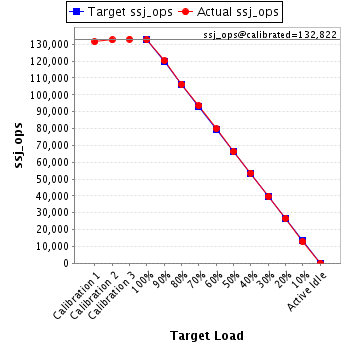
| ssj_ops@calibrated=132,822 | |||
| 100% | 99.8% | 132,822 | 132,606 |
| 90% | 90.5% | 119,540 | 120,230 |
| 80% | 80.0% | 106,258 | 106,314 |
| 70% | 70.4% | 92,975 | 93,542 |
| 60% | 60.1% | 79,693 | 79,864 |
| 50% | 50.0% | 66,411 | 66,365 |
| 40% | 40.3% | 53,129 | 53,592 |
| 30% | 29.9% | 39,847 | 39,648 |
| 20% | 20.1% | 26,564 | 26,709 |
| 10% | 9.7% | 13,282 | 12,883 |
| Active Idle | 0 | 0 | |