
SPECpower_ssj2008
Host 'Node-21' Performance Report
Copyright © 2007-2010 Standard Performance Evaluation Corporation
| Fujitsu PRIMERGY CX120 S1 (Intel Xeon L5530) | ssj_ops@100% = 522,898 ssj_ops@100% per JVM = 130,724 |
||||
| Test Sponsor: | Fujitsu | SPEC License #: | 19 | Test Method: | Multi Node |
| Tested By: | Fujitsu | Test Location: | Paderborn, NRW, Germany | Test Date: | Mar 7, 2010 |
| Hardware Availability: | Jun-2010 | Software Availability: | Nov-2009 | Publication: | Mar 24, 2010 |
| System Source: | Single Supplier | System Designation: | Server | Power Provisioning: | Line-powered |
| Target Load | Actual Load | ssj_ops | |
|---|---|---|---|
| Target | Actual | ||
| Calibration 1 | 527,214 | ||
| Calibration 2 | 526,627 | ||
| Calibration 3 | 526,972 | ||
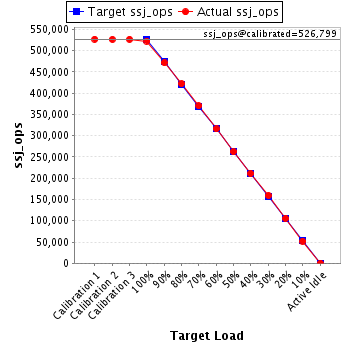
| ssj_ops@calibrated=526,799 | |||
| 100% | 99.3% | 526,799 | 522,898 |
| 90% | 89.6% | 474,119 | 471,753 |
| 80% | 80.2% | 421,439 | 422,335 |
| 70% | 70.3% | 368,759 | 370,407 |
| 60% | 60.0% | 316,079 | 316,196 |
| 50% | 49.8% | 263,400 | 262,311 |
| 40% | 40.1% | 210,720 | 211,258 |
| 30% | 30.3% | 158,040 | 159,524 |
| 20% | 20.1% | 105,360 | 105,756 |
| 10% | 9.9% | 52,680 | 52,009 |
| Active Idle | 0 | 0 | |
| Set Identifier: | SUT |
| Set Description: | Set of 38 identically configured PRIMERGY CX120 S1 servers |
| # of Identical Nodes: | 38 |
| Comment: | None |
| Hardware | |
|---|---|
| Hardware Vendor: | Fujitsu |
| Model: | PRIMERGY CX120 S1 (Intel Xeon L5530) |
| Form Factor: | 1U |
| CPU Name: | Intel Xeon L5530 |
| CPU Characteristics: | Quad-Core, 2.40GHz, 8MB L3 Cache |
| CPU Frequency (MHz): | 2400 |
| CPU(s) Enabled: | 8 cores, 2 chips, 4 cores/chip |
| Hardware Threads: | 16 (2 / core) |
| CPU(s) Orderable: | 1,2 chips |
| Primary Cache: | 32 KB I + 32 KB D on chip per core |
| Secondary Cache: | 256 KB I+D on chip per core |
| Tertiary Cache: | 8 MB I+D on chip per chip |
| Other Cache: | None |
| Memory Amount (GB): | 8 |
| # and size of DIMM: | 4 x 2048 MB |
| Memory Details: | 2GB 2Rx8 PC3-10600E ECC CL9; slots B1, C1, E1, F1 populated |
| Power Supply Quantity and Rating (W): | 1 x 400 |
| Power Supply Details: | Fujitsu Technology Solutions DPS-460GP A |
| Disk Drive: | 1 x 160GB HDD SATA (2.5", 5.4krpm) |
| Disk Controller: | Integrated SATA Controller |
| # and type of Network Interface Cards (NICs) Installed: | 2 x Intel 82576 Gigabit Network Connection (onboard) |
| NICs Enabled in Firmware / OS / Connected: | 2/1/1 |
| Network Speed (Mbit): | 1000 |
| Keyboard: | None |
| Mouse: | None |
| Monitor: | None |
| Optical Drives: | No |
| Other Hardware: | None |
| Software | |
|---|---|
| Power Management: | Enabled ("Fujitsu Enhanced Power Settings" power plan) |
| Operating System (OS): | Microsoft Windows Server 2008 R2 Enterprise |
| OS Version: | Version 6.1.7600 Build 7600 |
| Filesystem: | NTFS |
| JVM Vendor: | IBM Corporation |
| JVM Version: | IBM J9 VM (build 2.4, JRE 1.6.0 IBM J9 2.4 Windows Server 2008 amd64-64 jvmwa6460sr6-20090923_42924 (JIT enabled, AOT enabled) |
| JVM Command-line Options: | -Xaggressive -Xcompressedrefs -Xgcpolicy:gencon -Xmn1400m -Xms1550m -Xmx1550m -XlockReservation -Xnoloa -XtlhPrefetch -Xlp -Xgcthreads4 |
| JVM Affinity: | start /affinity [0x000F,0x00F0,0x0F00,0xF000] |
| JVM Instances: | 4 |
| JVM Initial Heap (MB): | 1550 |
| JVM Maximum Heap (MB): | 1550 |
| JVM Address Bits: | 64 |
| Boot Firmware Version: | 0.46 |
| Management Firmware Version: | 0.48 |
| Workload Version: | SSJ 1.2.6 |
| Director Location: | Controller |
| Other Software: | None |
| JVM Instance | ssj_ops@100% |
|---|---|
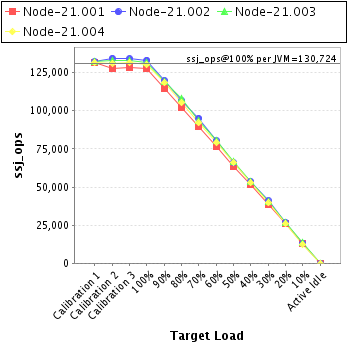
| Node-21.001 | 127,536 |
| Node-21.002 | 133,271 |
| Node-21.003 | 131,755 |
| Node-21.004 | 130,336 |
| ssj_ops@100% | 522,898 |
| ssj_ops@100% per JVM | 130,724 |
| Target Load | Actual Load | ssj_ops | |
|---|---|---|---|
| Target | Actual | ||
| Calibration 1 | 131,407 | ||
| Calibration 2 | 127,783 | ||
| Calibration 3 | 128,320 | ||
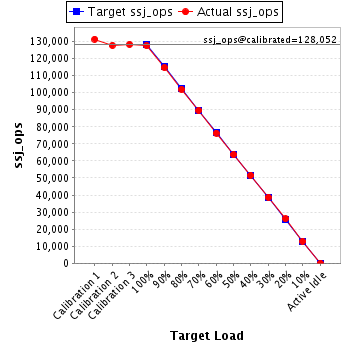
| ssj_ops@calibrated=128,052 | |||
| 100% | 99.6% | 128,052 | 127,536 |
| 90% | 89.6% | 115,246 | 114,737 |
| 80% | 79.6% | 102,441 | 101,987 |
| 70% | 70.0% | 89,636 | 89,641 |
| 60% | 59.6% | 76,831 | 76,360 |
| 50% | 49.7% | 64,026 | 63,610 |
| 40% | 40.2% | 51,221 | 51,503 |
| 30% | 30.3% | 38,415 | 38,745 |
| 20% | 20.4% | 25,610 | 26,130 |
| 10% | 10.1% | 12,805 | 12,908 |
| Active Idle | 0 | 0 | |
| Target Load | Actual Load | ssj_ops | |
|---|---|---|---|
| Target | Actual | ||
| Calibration 1 | 132,085 | ||
| Calibration 2 | 134,497 | ||
| Calibration 3 | 134,097 | ||
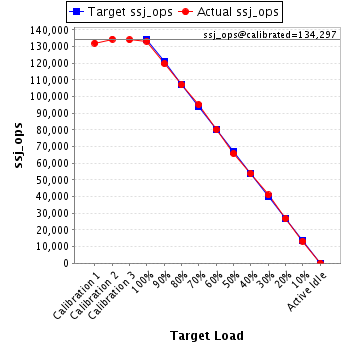
| ssj_ops@calibrated=134,297 | |||
| 100% | 99.2% | 134,297 | 133,271 |
| 90% | 89.2% | 120,867 | 119,840 |
| 80% | 79.7% | 107,438 | 107,034 |
| 70% | 70.8% | 94,008 | 95,130 |
| 60% | 59.8% | 80,578 | 80,261 |
| 50% | 49.0% | 67,149 | 65,854 |
| 40% | 40.0% | 53,719 | 53,709 |
| 30% | 30.5% | 40,289 | 40,990 |
| 20% | 20.0% | 26,859 | 26,825 |
| 10% | 9.9% | 13,430 | 13,262 |
| Active Idle | 0 | 0 | |
| Target Load | Actual Load | ssj_ops | |
|---|---|---|---|
| Target | Actual | ||
| Calibration 1 | 132,171 | ||
| Calibration 2 | 133,084 | ||
| Calibration 3 | 132,872 | ||
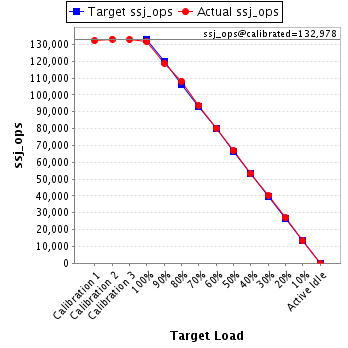
| ssj_ops@calibrated=132,978 | |||
| 100% | 99.1% | 132,978 | 131,755 |
| 90% | 89.4% | 119,680 | 118,889 |
| 80% | 81.3% | 106,382 | 108,133 |
| 70% | 70.4% | 93,085 | 93,590 |
| 60% | 60.4% | 79,787 | 80,298 |
| 50% | 50.2% | 66,489 | 66,807 |
| 40% | 40.1% | 53,191 | 53,308 |
| 30% | 30.3% | 39,893 | 40,243 |
| 20% | 20.2% | 26,596 | 26,913 |
| 10% | 10.0% | 13,298 | 13,328 |
| Active Idle | 0 | 0 | |
| Target Load | Actual Load | ssj_ops | |
|---|---|---|---|
| Target | Actual | ||
| Calibration 1 | 131,551 | ||
| Calibration 2 | 131,262 | ||
| Calibration 3 | 131,683 | ||
| ssj_ops@calibrated=131,473 | |||
| 100% | 99.1% | 131,473 | 130,336 |
| 90% | 90.0% | 118,325 | 118,288 |
| 80% | 80.0% | 105,178 | 105,181 |
| 70% | 70.0% | 92,031 | 92,046 |
| 60% | 60.3% | 78,884 | 79,277 |
| 50% | 50.2% | 65,736 | 66,040 |
| 40% | 40.1% | 52,589 | 52,738 |
| 30% | 30.1% | 39,442 | 39,546 |
| 20% | 19.7% | 26,295 | 25,887 |
| 10% | 9.5% | 13,147 | 12,512 |
| Active Idle | 0 | 0 | |
