SPECpower_ssj2008
Host 'Node-22' Performance Report
Copyright © 2007-2010 Standard Performance Evaluation Corporation
| Fujitsu PRIMERGY CX120 S1 (Intel Xeon L5530) | ssj_ops@100% = 527,488 ssj_ops@100% per JVM = 131,872 |
||||
| Test Sponsor: | Fujitsu | SPEC License #: | 19 | Test Method: | Multi Node |
| Tested By: | Fujitsu | Test Location: | Paderborn, NRW, Germany | Test Date: | Mar 7, 2010 |
| Hardware Availability: | Jun-2010 | Software Availability: | Nov-2009 | Publication: | Mar 24, 2010 |
| System Source: | Single Supplier | System Designation: | Server | Power Provisioning: | Line-powered |
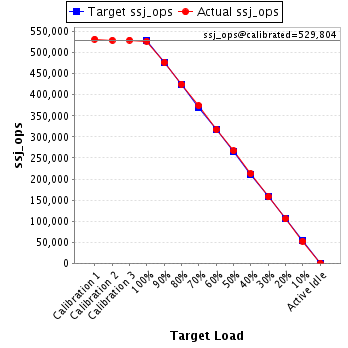
| Target Load | Actual Load | ssj_ops | |
|---|---|---|---|
| Target | Actual | ||
| Calibration 1 | 532,063 | ||
| Calibration 2 | 529,565 | ||
| Calibration 3 | 530,043 | ||
| ssj_ops@calibrated=529,804 | |||
| 100% | 99.6% | 529,804 | 527,488 |
| 90% | 90.0% | 476,823 | 476,843 |
| 80% | 80.3% | 423,843 | 425,296 |
| 70% | 70.6% | 370,863 | 374,244 |
| 60% | 59.9% | 317,882 | 317,543 |
| 50% | 50.4% | 264,902 | 266,854 |
| 40% | 40.2% | 211,921 | 212,756 |
| 30% | 29.8% | 158,941 | 157,910 |
| 20% | 19.9% | 105,961 | 105,224 |
| 10% | 9.9% | 52,980 | 52,550 |
| Active Idle | 0 | 0 | |
| Set Identifier: | SUT |
| Set Description: | Set of 38 identically configured PRIMERGY CX120 S1 servers |
| # of Identical Nodes: | 38 |
| Comment: | None |
| Hardware | |
|---|---|
| Hardware Vendor: | Fujitsu |
| Model: | PRIMERGY CX120 S1 (Intel Xeon L5530) |
| Form Factor: | 1U |
| CPU Name: | Intel Xeon L5530 |
| CPU Characteristics: | Quad-Core, 2.40GHz, 8MB L3 Cache |
| CPU Frequency (MHz): | 2400 |
| CPU(s) Enabled: | 8 cores, 2 chips, 4 cores/chip |
| Hardware Threads: | 16 (2 / core) |
| CPU(s) Orderable: | 1,2 chips |
| Primary Cache: | 32 KB I + 32 KB D on chip per core |
| Secondary Cache: | 256 KB I+D on chip per core |
| Tertiary Cache: | 8 MB I+D on chip per chip |
| Other Cache: | None |
| Memory Amount (GB): | 8 |
| # and size of DIMM: | 4 x 2048 MB |
| Memory Details: | 2GB 2Rx8 PC3-10600E ECC CL9; slots B1, C1, E1, F1 populated |
| Power Supply Quantity and Rating (W): | 1 x 400 |
| Power Supply Details: | Fujitsu Technology Solutions DPS-460GP A |
| Disk Drive: | 1 x 160GB HDD SATA (2.5", 5.4krpm) |
| Disk Controller: | Integrated SATA Controller |
| # and type of Network Interface Cards (NICs) Installed: | 2 x Intel 82576 Gigabit Network Connection (onboard) |
| NICs Enabled in Firmware / OS / Connected: | 2/1/1 |
| Network Speed (Mbit): | 1000 |
| Keyboard: | None |
| Mouse: | None |
| Monitor: | None |
| Optical Drives: | No |
| Other Hardware: | None |
| Software | |
|---|---|
| Power Management: | Enabled ("Fujitsu Enhanced Power Settings" power plan) |
| Operating System (OS): | Microsoft Windows Server 2008 R2 Enterprise |
| OS Version: | Version 6.1.7600 Build 7600 |
| Filesystem: | NTFS |
| JVM Vendor: | IBM Corporation |
| JVM Version: | IBM J9 VM (build 2.4, JRE 1.6.0 IBM J9 2.4 Windows Server 2008 amd64-64 jvmwa6460sr6-20090923_42924 (JIT enabled, AOT enabled) |
| JVM Command-line Options: | -Xaggressive -Xcompressedrefs -Xgcpolicy:gencon -Xmn1400m -Xms1550m -Xmx1550m -XlockReservation -Xnoloa -XtlhPrefetch -Xlp -Xgcthreads4 |
| JVM Affinity: | start /affinity [0x000F,0x00F0,0x0F00,0xF000] |
| JVM Instances: | 4 |
| JVM Initial Heap (MB): | 1550 |
| JVM Maximum Heap (MB): | 1550 |
| JVM Address Bits: | 64 |
| Boot Firmware Version: | 0.46 |
| Management Firmware Version: | 0.48 |
| Workload Version: | SSJ 1.2.6 |
| Director Location: | Controller |
| Other Software: | None |
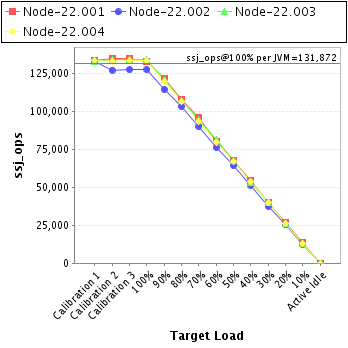
| JVM Instance | ssj_ops@100% |
|---|---|
| Node-22.001 | 132,789 |
| Node-22.002 | 127,529 |
| Node-22.003 | 133,941 |
| Node-22.004 | 133,229 |
| ssj_ops@100% | 527,488 |
| ssj_ops@100% per JVM | 131,872 |
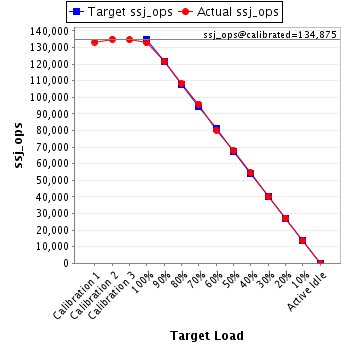
| Target Load | Actual Load | ssj_ops | |
|---|---|---|---|
| Target | Actual | ||
| Calibration 1 | 133,335 | ||
| Calibration 2 | 135,048 | ||
| Calibration 3 | 134,701 | ||
| ssj_ops@calibrated=134,875 | |||
| 100% | 98.5% | 134,875 | 132,789 |
| 90% | 90.1% | 121,387 | 121,523 |
| 80% | 80.1% | 107,900 | 108,092 |
| 70% | 71.1% | 94,412 | 95,940 |
| 60% | 59.5% | 80,925 | 80,281 |
| 50% | 50.2% | 67,437 | 67,767 |
| 40% | 40.3% | 53,950 | 54,416 |
| 30% | 29.9% | 40,462 | 40,325 |
| 20% | 20.0% | 26,975 | 26,925 |
| 10% | 10.0% | 13,487 | 13,546 |
| Active Idle | 0 | 0 | |
| Target Load | Actual Load | ssj_ops | |
|---|---|---|---|
| Target | Actual | ||
| Calibration 1 | 132,743 | ||
| Calibration 2 | 127,259 | ||
| Calibration 3 | 127,417 | ||
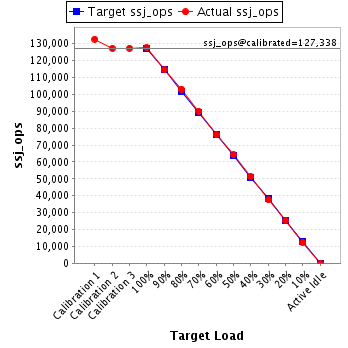
| ssj_ops@calibrated=127,338 | |||
| 100% | 100.1% | 127,338 | 127,529 |
| 90% | 90.0% | 114,604 | 114,569 |
| 80% | 81.1% | 101,870 | 103,218 |
| 70% | 70.8% | 89,137 | 90,138 |
| 60% | 59.8% | 76,403 | 76,191 |
| 50% | 50.5% | 63,669 | 64,305 |
| 40% | 40.3% | 50,935 | 51,362 |
| 30% | 29.6% | 38,201 | 37,630 |
| 20% | 20.0% | 25,468 | 25,432 |
| 10% | 9.8% | 12,734 | 12,495 |
| Active Idle | 0 | 0 | |
| Target Load | Actual Load | ssj_ops | |
|---|---|---|---|
| Target | Actual | ||
| Calibration 1 | 132,698 | ||
| Calibration 2 | 134,262 | ||
| Calibration 3 | 134,278 | ||
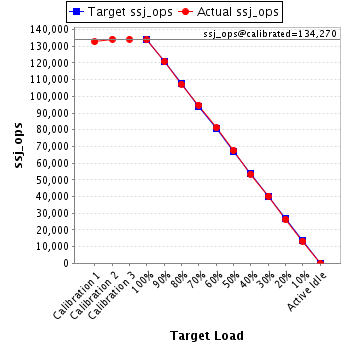
| ssj_ops@calibrated=134,270 | |||
| 100% | 99.8% | 134,270 | 133,941 |
| 90% | 90.0% | 120,843 | 120,844 |
| 80% | 80.0% | 107,416 | 107,397 |
| 70% | 70.6% | 93,989 | 94,735 |
| 60% | 60.5% | 80,562 | 81,219 |
| 50% | 50.3% | 67,135 | 67,557 |
| 40% | 39.8% | 53,708 | 53,440 |
| 30% | 30.0% | 40,281 | 40,243 |
| 20% | 19.7% | 26,854 | 26,401 |
| 10% | 9.9% | 13,427 | 13,308 |
| Active Idle | 0 | 0 | |
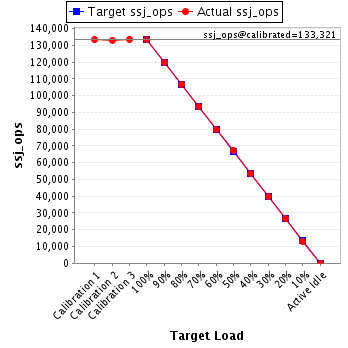
| Target Load | Actual Load | ssj_ops | |
|---|---|---|---|
| Target | Actual | ||
| Calibration 1 | 133,287 | ||
| Calibration 2 | 132,995 | ||
| Calibration 3 | 133,646 | ||
| ssj_ops@calibrated=133,321 | |||
| 100% | 99.9% | 133,321 | 133,229 |
| 90% | 89.9% | 119,989 | 119,907 |
| 80% | 79.9% | 106,657 | 106,590 |
| 70% | 70.1% | 93,325 | 93,431 |
| 60% | 59.9% | 79,993 | 79,851 |
| 50% | 50.4% | 66,660 | 67,225 |
| 40% | 40.2% | 53,328 | 53,539 |
| 30% | 29.8% | 39,996 | 39,712 |
| 20% | 19.9% | 26,664 | 26,467 |
| 10% | 9.9% | 13,332 | 13,201 |
| Active Idle | 0 | 0 | |