SPECpower_ssj2008
Host 'Node-23' Performance Report
Copyright © 2007-2010 Standard Performance Evaluation Corporation
| Fujitsu PRIMERGY CX120 S1 (Intel Xeon L5530) | ssj_ops@100% = 521,967 ssj_ops@100% per JVM = 130,492 |
||||
| Test Sponsor: | Fujitsu | SPEC License #: | 19 | Test Method: | Multi Node |
| Tested By: | Fujitsu | Test Location: | Paderborn, NRW, Germany | Test Date: | Mar 7, 2010 |
| Hardware Availability: | Jun-2010 | Software Availability: | Nov-2009 | Publication: | Mar 24, 2010 |
| System Source: | Single Supplier | System Designation: | Server | Power Provisioning: | Line-powered |
| Target Load | Actual Load | ssj_ops | |
|---|---|---|---|
| Target | Actual | ||
| Calibration 1 | 526,081 | ||
| Calibration 2 | 525,622 | ||
| Calibration 3 | 526,656 | ||
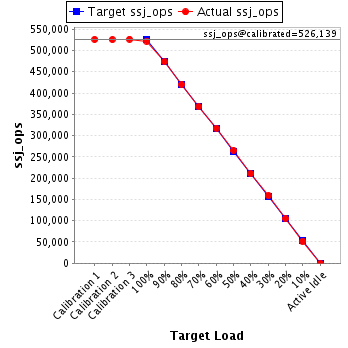
| ssj_ops@calibrated=526,139 | |||
| 100% | 99.2% | 526,139 | 521,967 |
| 90% | 90.0% | 473,525 | 473,615 |
| 80% | 79.8% | 420,911 | 420,006 |
| 70% | 70.0% | 368,297 | 368,206 |
| 60% | 60.4% | 315,683 | 317,605 |
| 50% | 50.4% | 263,070 | 265,363 |
| 40% | 40.0% | 210,456 | 210,420 |
| 30% | 30.1% | 157,842 | 158,620 |
| 20% | 20.0% | 105,228 | 105,200 |
| 10% | 9.9% | 52,614 | 52,196 |
| Active Idle | 0 | 0 | |
| Set Identifier: | SUT |
| Set Description: | Set of 38 identically configured PRIMERGY CX120 S1 servers |
| # of Identical Nodes: | 38 |
| Comment: | None |
| Hardware | |
|---|---|
| Hardware Vendor: | Fujitsu |
| Model: | PRIMERGY CX120 S1 (Intel Xeon L5530) |
| Form Factor: | 1U |
| CPU Name: | Intel Xeon L5530 |
| CPU Characteristics: | Quad-Core, 2.40GHz, 8MB L3 Cache |
| CPU Frequency (MHz): | 2400 |
| CPU(s) Enabled: | 8 cores, 2 chips, 4 cores/chip |
| Hardware Threads: | 16 (2 / core) |
| CPU(s) Orderable: | 1,2 chips |
| Primary Cache: | 32 KB I + 32 KB D on chip per core |
| Secondary Cache: | 256 KB I+D on chip per core |
| Tertiary Cache: | 8 MB I+D on chip per chip |
| Other Cache: | None |
| Memory Amount (GB): | 8 |
| # and size of DIMM: | 4 x 2048 MB |
| Memory Details: | 2GB 2Rx8 PC3-10600E ECC CL9; slots B1, C1, E1, F1 populated |
| Power Supply Quantity and Rating (W): | 1 x 400 |
| Power Supply Details: | Fujitsu Technology Solutions DPS-460GP A |
| Disk Drive: | 1 x 160GB HDD SATA (2.5", 5.4krpm) |
| Disk Controller: | Integrated SATA Controller |
| # and type of Network Interface Cards (NICs) Installed: | 2 x Intel 82576 Gigabit Network Connection (onboard) |
| NICs Enabled in Firmware / OS / Connected: | 2/1/1 |
| Network Speed (Mbit): | 1000 |
| Keyboard: | None |
| Mouse: | None |
| Monitor: | None |
| Optical Drives: | No |
| Other Hardware: | None |
| Software | |
|---|---|
| Power Management: | Enabled ("Fujitsu Enhanced Power Settings" power plan) |
| Operating System (OS): | Microsoft Windows Server 2008 R2 Enterprise |
| OS Version: | Version 6.1.7600 Build 7600 |
| Filesystem: | NTFS |
| JVM Vendor: | IBM Corporation |
| JVM Version: | IBM J9 VM (build 2.4, JRE 1.6.0 IBM J9 2.4 Windows Server 2008 amd64-64 jvmwa6460sr6-20090923_42924 (JIT enabled, AOT enabled) |
| JVM Command-line Options: | -Xaggressive -Xcompressedrefs -Xgcpolicy:gencon -Xmn1400m -Xms1550m -Xmx1550m -XlockReservation -Xnoloa -XtlhPrefetch -Xlp -Xgcthreads4 |
| JVM Affinity: | start /affinity [0x000F,0x00F0,0x0F00,0xF000] |
| JVM Instances: | 4 |
| JVM Initial Heap (MB): | 1550 |
| JVM Maximum Heap (MB): | 1550 |
| JVM Address Bits: | 64 |
| Boot Firmware Version: | 0.46 |
| Management Firmware Version: | 0.48 |
| Workload Version: | SSJ 1.2.6 |
| Director Location: | Controller |
| Other Software: | None |
| JVM Instance | ssj_ops@100% |
|---|---|
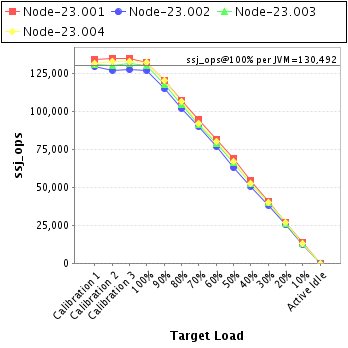
| Node-23.001 | 132,386 |
| Node-23.002 | 126,956 |
| Node-23.003 | 130,109 |
| Node-23.004 | 132,516 |
| ssj_ops@100% | 521,967 |
| ssj_ops@100% per JVM | 130,492 |
| Target Load | Actual Load | ssj_ops | |
|---|---|---|---|
| Target | Actual | ||
| Calibration 1 | 134,446 | ||
| Calibration 2 | 135,060 | ||
| Calibration 3 | 134,689 | ||
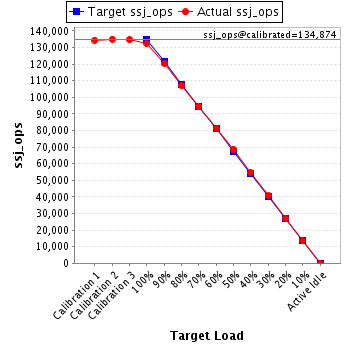
| ssj_ops@calibrated=134,874 | |||
| 100% | 98.2% | 134,874 | 132,386 |
| 90% | 89.3% | 121,387 | 120,452 |
| 80% | 79.5% | 107,899 | 107,196 |
| 70% | 70.1% | 94,412 | 94,542 |
| 60% | 60.4% | 80,924 | 81,413 |
| 50% | 50.9% | 67,437 | 68,666 |
| 40% | 40.5% | 53,950 | 54,607 |
| 30% | 30.2% | 40,462 | 40,740 |
| 20% | 19.9% | 26,975 | 26,894 |
| 10% | 10.0% | 13,487 | 13,446 |
| Active Idle | 0 | 0 | |
| Target Load | Actual Load | ssj_ops | |
|---|---|---|---|
| Target | Actual | ||
| Calibration 1 | 129,307 | ||
| Calibration 2 | 127,026 | ||
| Calibration 3 | 127,611 | ||
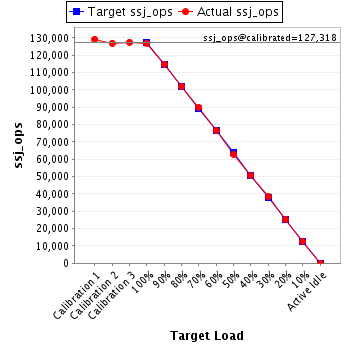
| ssj_ops@calibrated=127,318 | |||
| 100% | 99.7% | 127,318 | 126,956 |
| 90% | 90.3% | 114,587 | 114,956 |
| 80% | 80.2% | 101,855 | 102,046 |
| 70% | 70.7% | 89,123 | 90,048 |
| 60% | 60.3% | 76,391 | 76,814 |
| 50% | 49.5% | 63,659 | 63,036 |
| 40% | 39.9% | 50,927 | 50,770 |
| 30% | 30.1% | 38,196 | 38,369 |
| 20% | 19.9% | 25,464 | 25,396 |
| 10% | 9.9% | 12,732 | 12,641 |
| Active Idle | 0 | 0 | |
| Target Load | Actual Load | ssj_ops | |
|---|---|---|---|
| Target | Actual | ||
| Calibration 1 | 130,623 | ||
| Calibration 2 | 130,339 | ||
| Calibration 3 | 131,388 | ||
| ssj_ops@calibrated=130,863 | |||
| 100% | 99.4% | 130,863 | 130,109 |
| 90% | 90.0% | 117,777 | 117,757 |
| 80% | 79.7% | 104,691 | 104,299 |
| 70% | 69.8% | 91,604 | 91,356 |
| 60% | 60.5% | 78,518 | 79,129 |
| 50% | 50.9% | 65,432 | 66,638 |
| 40% | 40.0% | 52,345 | 52,346 |
| 30% | 30.4% | 39,259 | 39,743 |
| 20% | 20.2% | 26,173 | 26,387 |
| 10% | 10.0% | 13,086 | 13,118 |
| Active Idle | 0 | 0 | |

| Target Load | Actual Load | ssj_ops | |
|---|---|---|---|
| Target | Actual | ||
| Calibration 1 | 131,705 | ||
| Calibration 2 | 133,197 | ||
| Calibration 3 | 132,969 | ||
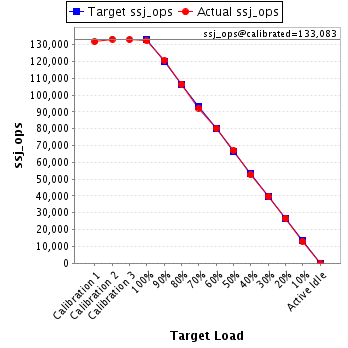
| ssj_ops@calibrated=133,083 | |||
| 100% | 99.6% | 133,083 | 132,516 |
| 90% | 90.5% | 119,775 | 120,450 |
| 80% | 80.0% | 106,466 | 106,465 |
| 70% | 69.3% | 93,158 | 92,260 |
| 60% | 60.3% | 79,850 | 80,249 |
| 50% | 50.4% | 66,542 | 67,023 |
| 40% | 39.6% | 53,233 | 52,696 |
| 30% | 29.9% | 39,925 | 39,769 |
| 20% | 19.9% | 26,617 | 26,523 |
| 10% | 9.8% | 13,308 | 12,991 |
| Active Idle | 0 | 0 | |