SPECpower_ssj2008
Host 'Node-25' Performance Report
Copyright © 2007-2010 Standard Performance Evaluation Corporation
| Fujitsu PRIMERGY CX120 S1 (Intel Xeon L5530) | ssj_ops@100% = 518,940 ssj_ops@100% per JVM = 129,735 |
||||
| Test Sponsor: | Fujitsu | SPEC License #: | 19 | Test Method: | Multi Node |
| Tested By: | Fujitsu | Test Location: | Paderborn, NRW, Germany | Test Date: | Mar 7, 2010 |
| Hardware Availability: | Jun-2010 | Software Availability: | Nov-2009 | Publication: | Mar 24, 2010 |
| System Source: | Single Supplier | System Designation: | Server | Power Provisioning: | Line-powered |
| Target Load | Actual Load | ssj_ops | |
|---|---|---|---|
| Target | Actual | ||
| Calibration 1 | 528,233 | ||
| Calibration 2 | 525,951 | ||
| Calibration 3 | 519,869 | ||
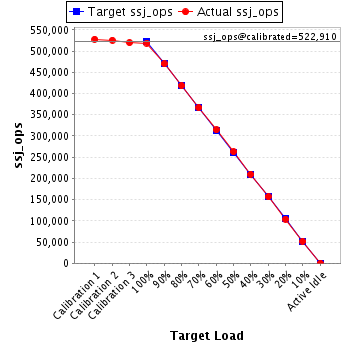
| ssj_ops@calibrated=522,910 | |||
| 100% | 99.2% | 522,910 | 518,940 |
| 90% | 89.9% | 470,619 | 470,033 |
| 80% | 80.0% | 418,328 | 418,332 |
| 70% | 70.1% | 366,037 | 366,733 |
| 60% | 60.2% | 313,746 | 314,690 |
| 50% | 50.2% | 261,455 | 262,734 |
| 40% | 40.2% | 209,164 | 209,965 |
| 30% | 30.0% | 156,873 | 156,674 |
| 20% | 19.9% | 104,582 | 104,297 |
| 10% | 9.9% | 52,291 | 51,865 |
| Active Idle | 0 | 0 | |
| Set Identifier: | SUT |
| Set Description: | Set of 38 identically configured PRIMERGY CX120 S1 servers |
| # of Identical Nodes: | 38 |
| Comment: | None |
| Hardware | |
|---|---|
| Hardware Vendor: | Fujitsu |
| Model: | PRIMERGY CX120 S1 (Intel Xeon L5530) |
| Form Factor: | 1U |
| CPU Name: | Intel Xeon L5530 |
| CPU Characteristics: | Quad-Core, 2.40GHz, 8MB L3 Cache |
| CPU Frequency (MHz): | 2400 |
| CPU(s) Enabled: | 8 cores, 2 chips, 4 cores/chip |
| Hardware Threads: | 16 (2 / core) |
| CPU(s) Orderable: | 1,2 chips |
| Primary Cache: | 32 KB I + 32 KB D on chip per core |
| Secondary Cache: | 256 KB I+D on chip per core |
| Tertiary Cache: | 8 MB I+D on chip per chip |
| Other Cache: | None |
| Memory Amount (GB): | 8 |
| # and size of DIMM: | 4 x 2048 MB |
| Memory Details: | 2GB 2Rx8 PC3-10600E ECC CL9; slots B1, C1, E1, F1 populated |
| Power Supply Quantity and Rating (W): | 1 x 400 |
| Power Supply Details: | Fujitsu Technology Solutions DPS-460GP A |
| Disk Drive: | 1 x 160GB HDD SATA (2.5", 5.4krpm) |
| Disk Controller: | Integrated SATA Controller |
| # and type of Network Interface Cards (NICs) Installed: | 2 x Intel 82576 Gigabit Network Connection (onboard) |
| NICs Enabled in Firmware / OS / Connected: | 2/1/1 |
| Network Speed (Mbit): | 1000 |
| Keyboard: | None |
| Mouse: | None |
| Monitor: | None |
| Optical Drives: | No |
| Other Hardware: | None |
| Software | |
|---|---|
| Power Management: | Enabled ("Fujitsu Enhanced Power Settings" power plan) |
| Operating System (OS): | Microsoft Windows Server 2008 R2 Enterprise |
| OS Version: | Version 6.1.7600 Build 7600 |
| Filesystem: | NTFS |
| JVM Vendor: | IBM Corporation |
| JVM Version: | IBM J9 VM (build 2.4, JRE 1.6.0 IBM J9 2.4 Windows Server 2008 amd64-64 jvmwa6460sr6-20090923_42924 (JIT enabled, AOT enabled) |
| JVM Command-line Options: | -Xaggressive -Xcompressedrefs -Xgcpolicy:gencon -Xmn1400m -Xms1550m -Xmx1550m -XlockReservation -Xnoloa -XtlhPrefetch -Xlp -Xgcthreads4 |
| JVM Affinity: | start /affinity [0x000F,0x00F0,0x0F00,0xF000] |
| JVM Instances: | 4 |
| JVM Initial Heap (MB): | 1550 |
| JVM Maximum Heap (MB): | 1550 |
| JVM Address Bits: | 64 |
| Boot Firmware Version: | 0.46 |
| Management Firmware Version: | 0.48 |
| Workload Version: | SSJ 1.2.6 |
| Director Location: | Controller |
| Other Software: | None |
| JVM Instance | ssj_ops@100% |
|---|---|
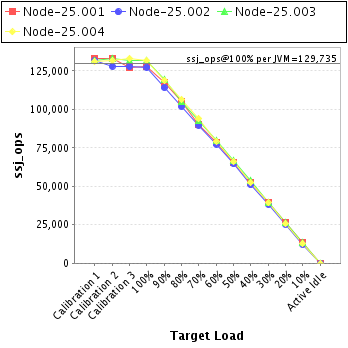
| Node-25.001 | 127,896 |
| Node-25.002 | 127,394 |
| Node-25.003 | 131,881 |
| Node-25.004 | 131,770 |
| ssj_ops@100% | 518,940 |
| ssj_ops@100% per JVM | 129,735 |
| Target Load | Actual Load | ssj_ops | |
|---|---|---|---|
| Target | Actual | ||
| Calibration 1 | 133,256 | ||
| Calibration 2 | 133,012 | ||
| Calibration 3 | 127,317 | ||
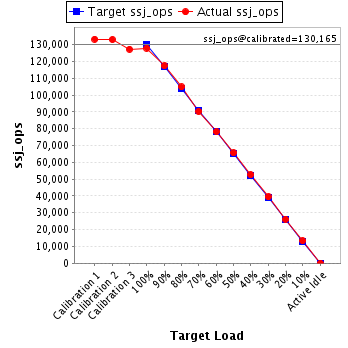
| ssj_ops@calibrated=130,165 | |||
| 100% | 98.3% | 130,165 | 127,896 |
| 90% | 90.2% | 117,148 | 117,392 |
| 80% | 80.5% | 104,132 | 104,834 |
| 70% | 69.4% | 91,115 | 90,331 |
| 60% | 60.1% | 78,099 | 78,204 |
| 50% | 50.4% | 65,082 | 65,596 |
| 40% | 40.4% | 52,066 | 52,600 |
| 30% | 30.3% | 39,049 | 39,458 |
| 20% | 20.2% | 26,033 | 26,262 |
| 10% | 10.2% | 13,016 | 13,337 |
| Active Idle | 0 | 0 | |
| Target Load | Actual Load | ssj_ops | |
|---|---|---|---|
| Target | Actual | ||
| Calibration 1 | 131,718 | ||
| Calibration 2 | 128,044 | ||
| Calibration 3 | 127,787 | ||
| ssj_ops@calibrated=127,916 | |||
| 100% | 99.6% | 127,916 | 127,394 |
| 90% | 89.3% | 115,124 | 114,190 |
| 80% | 79.6% | 102,333 | 101,867 |
| 70% | 70.1% | 89,541 | 89,659 |
| 60% | 60.5% | 76,749 | 77,434 |
| 50% | 50.5% | 63,958 | 64,559 |
| 40% | 39.8% | 51,166 | 50,918 |
| 30% | 29.9% | 38,375 | 38,297 |
| 20% | 19.9% | 25,583 | 25,449 |
| 10% | 9.6% | 12,792 | 12,216 |
| Active Idle | 0 | 0 | |

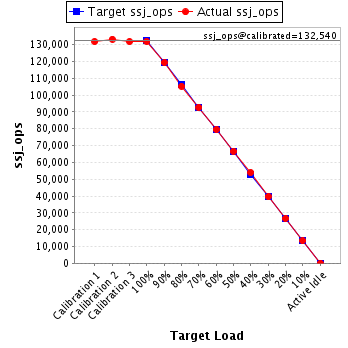
| Target Load | Actual Load | ssj_ops | |
|---|---|---|---|
| Target | Actual | ||
| Calibration 1 | 131,851 | ||
| Calibration 2 | 133,287 | ||
| Calibration 3 | 131,792 | ||
| ssj_ops@calibrated=132,540 | |||
| 100% | 99.5% | 132,540 | 131,881 |
| 90% | 90.1% | 119,286 | 119,424 |
| 80% | 79.5% | 106,032 | 105,310 |
| 70% | 70.0% | 92,778 | 92,743 |
| 60% | 60.1% | 79,524 | 79,601 |
| 50% | 50.3% | 66,270 | 66,725 |
| 40% | 40.7% | 53,016 | 53,968 |
| 30% | 29.9% | 39,762 | 39,669 |
| 20% | 20.2% | 26,508 | 26,733 |
| 10% | 10.1% | 13,254 | 13,378 |
| Active Idle | 0 | 0 | |
| Target Load | Actual Load | ssj_ops | |
|---|---|---|---|
| Target | Actual | ||
| Calibration 1 | 131,409 | ||
| Calibration 2 | 131,607 | ||
| Calibration 3 | 132,973 | ||
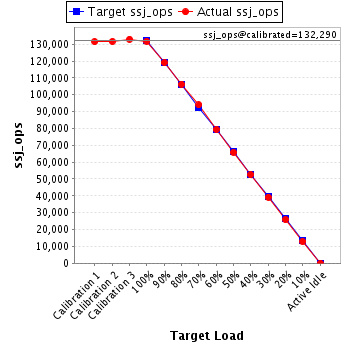
| ssj_ops@calibrated=132,290 | |||
| 100% | 99.6% | 132,290 | 131,770 |
| 90% | 90.0% | 119,061 | 119,028 |
| 80% | 80.4% | 105,832 | 106,320 |
| 70% | 71.1% | 92,603 | 94,000 |
| 60% | 60.1% | 79,374 | 79,452 |
| 50% | 49.8% | 66,145 | 65,855 |
| 40% | 39.7% | 52,916 | 52,478 |
| 30% | 29.7% | 39,687 | 39,250 |
| 20% | 19.5% | 26,458 | 25,853 |
| 10% | 9.8% | 13,229 | 12,933 |
| Active Idle | 0 | 0 | |