SPECpower_ssj2008
Host 'Node-26' Performance Report
Copyright © 2007-2010 Standard Performance Evaluation Corporation
| Fujitsu PRIMERGY CX120 S1 (Intel Xeon L5530) | ssj_ops@100% = 522,126 ssj_ops@100% per JVM = 130,532 |
||||
| Test Sponsor: | Fujitsu | SPEC License #: | 19 | Test Method: | Multi Node |
| Tested By: | Fujitsu | Test Location: | Paderborn, NRW, Germany | Test Date: | Mar 7, 2010 |
| Hardware Availability: | Jun-2010 | Software Availability: | Nov-2009 | Publication: | Mar 24, 2010 |
| System Source: | Single Supplier | System Designation: | Server | Power Provisioning: | Line-powered |
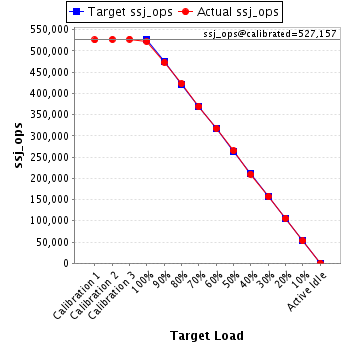
| Target Load | Actual Load | ssj_ops | |
|---|---|---|---|
| Target | Actual | ||
| Calibration 1 | 525,644 | ||
| Calibration 2 | 526,772 | ||
| Calibration 3 | 527,542 | ||
| ssj_ops@calibrated=527,157 | |||
| 100% | 99.0% | 527,157 | 522,126 |
| 90% | 89.7% | 474,441 | 472,946 |
| 80% | 80.2% | 421,726 | 422,738 |
| 70% | 70.0% | 369,010 | 369,070 |
| 60% | 60.2% | 316,294 | 317,540 |
| 50% | 50.2% | 263,578 | 264,663 |
| 40% | 39.7% | 210,863 | 209,534 |
| 30% | 29.8% | 158,147 | 157,124 |
| 20% | 20.1% | 105,431 | 105,834 |
| 10% | 10.0% | 52,716 | 52,793 |
| Active Idle | 0 | 0 | |
| Set Identifier: | SUT |
| Set Description: | Set of 38 identically configured PRIMERGY CX120 S1 servers |
| # of Identical Nodes: | 38 |
| Comment: | None |
| Hardware | |
|---|---|
| Hardware Vendor: | Fujitsu |
| Model: | PRIMERGY CX120 S1 (Intel Xeon L5530) |
| Form Factor: | 1U |
| CPU Name: | Intel Xeon L5530 |
| CPU Characteristics: | Quad-Core, 2.40GHz, 8MB L3 Cache |
| CPU Frequency (MHz): | 2400 |
| CPU(s) Enabled: | 8 cores, 2 chips, 4 cores/chip |
| Hardware Threads: | 16 (2 / core) |
| CPU(s) Orderable: | 1,2 chips |
| Primary Cache: | 32 KB I + 32 KB D on chip per core |
| Secondary Cache: | 256 KB I+D on chip per core |
| Tertiary Cache: | 8 MB I+D on chip per chip |
| Other Cache: | None |
| Memory Amount (GB): | 8 |
| # and size of DIMM: | 4 x 2048 MB |
| Memory Details: | 2GB 2Rx8 PC3-10600E ECC CL9; slots B1, C1, E1, F1 populated |
| Power Supply Quantity and Rating (W): | 1 x 400 |
| Power Supply Details: | Fujitsu Technology Solutions DPS-460GP A |
| Disk Drive: | 1 x 160GB HDD SATA (2.5", 5.4krpm) |
| Disk Controller: | Integrated SATA Controller |
| # and type of Network Interface Cards (NICs) Installed: | 2 x Intel 82576 Gigabit Network Connection (onboard) |
| NICs Enabled in Firmware / OS / Connected: | 2/1/1 |
| Network Speed (Mbit): | 1000 |
| Keyboard: | None |
| Mouse: | None |
| Monitor: | None |
| Optical Drives: | No |
| Other Hardware: | None |
| Software | |
|---|---|
| Power Management: | Enabled ("Fujitsu Enhanced Power Settings" power plan) |
| Operating System (OS): | Microsoft Windows Server 2008 R2 Enterprise |
| OS Version: | Version 6.1.7600 Build 7600 |
| Filesystem: | NTFS |
| JVM Vendor: | IBM Corporation |
| JVM Version: | IBM J9 VM (build 2.4, JRE 1.6.0 IBM J9 2.4 Windows Server 2008 amd64-64 jvmwa6460sr6-20090923_42924 (JIT enabled, AOT enabled) |
| JVM Command-line Options: | -Xaggressive -Xcompressedrefs -Xgcpolicy:gencon -Xmn1400m -Xms1550m -Xmx1550m -XlockReservation -Xnoloa -XtlhPrefetch -Xlp -Xgcthreads4 |
| JVM Affinity: | start /affinity [0x000F,0x00F0,0x0F00,0xF000] |
| JVM Instances: | 4 |
| JVM Initial Heap (MB): | 1550 |
| JVM Maximum Heap (MB): | 1550 |
| JVM Address Bits: | 64 |
| Boot Firmware Version: | 0.46 |
| Management Firmware Version: | 0.48 |
| Workload Version: | SSJ 1.2.6 |
| Director Location: | Controller |
| Other Software: | None |
| JVM Instance | ssj_ops@100% |
|---|---|
| Node-26.001 | 133,179 |
| Node-26.002 | 133,407 |
| Node-26.003 | 125,897 |
| Node-26.004 | 129,644 |
| ssj_ops@100% | 522,126 |
| ssj_ops@100% per JVM | 130,532 |

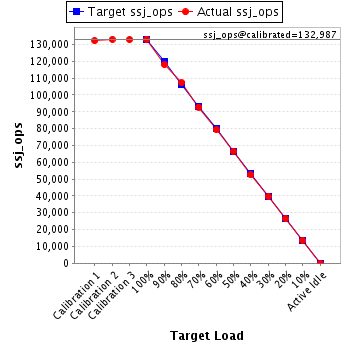
| Target Load | Actual Load | ssj_ops | |
|---|---|---|---|
| Target | Actual | ||
| Calibration 1 | 132,251 | ||
| Calibration 2 | 133,041 | ||
| Calibration 3 | 132,932 | ||
| ssj_ops@calibrated=132,987 | |||
| 100% | 100.1% | 132,987 | 133,179 |
| 90% | 88.8% | 119,688 | 118,088 |
| 80% | 80.7% | 106,389 | 107,265 |
| 70% | 69.8% | 93,091 | 92,864 |
| 60% | 59.7% | 79,792 | 79,370 |
| 50% | 50.1% | 66,493 | 66,684 |
| 40% | 39.5% | 53,195 | 52,550 |
| 30% | 29.9% | 39,896 | 39,737 |
| 20% | 19.8% | 26,597 | 26,324 |
| 10% | 10.2% | 13,299 | 13,499 |
| Active Idle | 0 | 0 | |
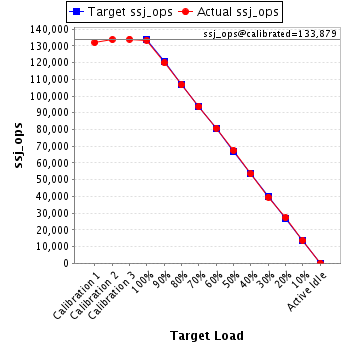
| Target Load | Actual Load | ssj_ops | |
|---|---|---|---|
| Target | Actual | ||
| Calibration 1 | 131,943 | ||
| Calibration 2 | 133,734 | ||
| Calibration 3 | 134,024 | ||
| ssj_ops@calibrated=133,879 | |||
| 100% | 99.6% | 133,879 | 133,407 |
| 90% | 89.6% | 120,491 | 119,953 |
| 80% | 79.7% | 107,103 | 106,655 |
| 70% | 70.0% | 93,715 | 93,671 |
| 60% | 60.4% | 80,327 | 80,846 |
| 50% | 50.4% | 66,939 | 67,498 |
| 40% | 39.9% | 53,552 | 53,394 |
| 30% | 29.6% | 40,164 | 39,565 |
| 20% | 20.3% | 26,776 | 27,191 |
| 10% | 10.2% | 13,388 | 13,678 |
| Active Idle | 0 | 0 | |
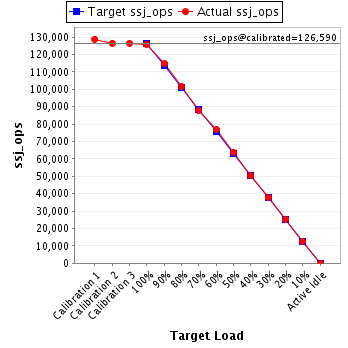
| Target Load | Actual Load | ssj_ops | |
|---|---|---|---|
| Target | Actual | ||
| Calibration 1 | 128,831 | ||
| Calibration 2 | 126,591 | ||
| Calibration 3 | 126,589 | ||
| ssj_ops@calibrated=126,590 | |||
| 100% | 99.5% | 126,590 | 125,897 |
| 90% | 90.8% | 113,931 | 114,928 |
| 80% | 80.2% | 101,272 | 101,491 |
| 70% | 69.5% | 88,613 | 87,920 |
| 60% | 60.7% | 75,954 | 76,816 |
| 50% | 50.4% | 63,295 | 63,846 |
| 40% | 39.6% | 50,636 | 50,176 |
| 30% | 29.8% | 37,977 | 37,745 |
| 20% | 20.0% | 25,318 | 25,375 |
| 10% | 10.0% | 12,659 | 12,672 |
| Active Idle | 0 | 0 | |
| Target Load | Actual Load | ssj_ops | |
|---|---|---|---|
| Target | Actual | ||
| Calibration 1 | 132,618 | ||
| Calibration 2 | 133,407 | ||
| Calibration 3 | 133,996 | ||
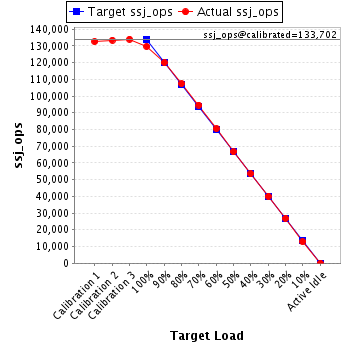
| ssj_ops@calibrated=133,702 | |||
| 100% | 97.0% | 133,702 | 129,644 |
| 90% | 89.7% | 120,331 | 119,977 |
| 80% | 80.3% | 106,961 | 107,327 |
| 70% | 70.8% | 93,591 | 94,616 |
| 60% | 60.2% | 80,221 | 80,508 |
| 50% | 49.8% | 66,851 | 66,635 |
| 40% | 39.9% | 53,481 | 53,413 |
| 30% | 30.0% | 40,110 | 40,076 |
| 20% | 20.2% | 26,740 | 26,944 |
| 10% | 9.7% | 13,370 | 12,944 |
| Active Idle | 0 | 0 | |