
SPECpower_ssj2008
Host 'Node-28' Performance Report
Copyright © 2007-2010 Standard Performance Evaluation Corporation
| Fujitsu PRIMERGY CX120 S1 (Intel Xeon L5530) | ssj_ops@100% = 516,965 ssj_ops@100% per JVM = 129,241 |
||||
| Test Sponsor: | Fujitsu | SPEC License #: | 19 | Test Method: | Multi Node |
| Tested By: | Fujitsu | Test Location: | Paderborn, NRW, Germany | Test Date: | Mar 7, 2010 |
| Hardware Availability: | Jun-2010 | Software Availability: | Nov-2009 | Publication: | Mar 24, 2010 |
| System Source: | Single Supplier | System Designation: | Server | Power Provisioning: | Line-powered |
| Target Load | Actual Load | ssj_ops | |
|---|---|---|---|
| Target | Actual | ||
| Calibration 1 | 525,630 | ||
| Calibration 2 | 524,437 | ||
| Calibration 3 | 519,544 | ||
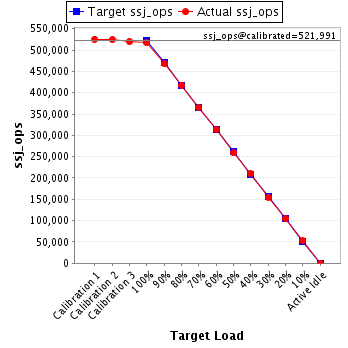
| ssj_ops@calibrated=521,991 | |||
| 100% | 99.0% | 521,991 | 516,965 |
| 90% | 89.7% | 469,792 | 468,262 |
| 80% | 80.1% | 417,592 | 417,859 |
| 70% | 70.0% | 365,393 | 365,168 |
| 60% | 60.0% | 313,194 | 313,301 |
| 50% | 49.6% | 260,995 | 258,772 |
| 40% | 40.2% | 208,796 | 209,750 |
| 30% | 29.8% | 156,597 | 155,413 |
| 20% | 19.9% | 104,398 | 103,927 |
| 10% | 10.0% | 52,199 | 52,321 |
| Active Idle | 0 | 0 | |
| Set Identifier: | SUT |
| Set Description: | Set of 38 identically configured PRIMERGY CX120 S1 servers |
| # of Identical Nodes: | 38 |
| Comment: | None |
| Hardware | |
|---|---|
| Hardware Vendor: | Fujitsu |
| Model: | PRIMERGY CX120 S1 (Intel Xeon L5530) |
| Form Factor: | 1U |
| CPU Name: | Intel Xeon L5530 |
| CPU Characteristics: | Quad-Core, 2.40GHz, 8MB L3 Cache |
| CPU Frequency (MHz): | 2400 |
| CPU(s) Enabled: | 8 cores, 2 chips, 4 cores/chip |
| Hardware Threads: | 16 (2 / core) |
| CPU(s) Orderable: | 1,2 chips |
| Primary Cache: | 32 KB I + 32 KB D on chip per core |
| Secondary Cache: | 256 KB I+D on chip per core |
| Tertiary Cache: | 8 MB I+D on chip per chip |
| Other Cache: | None |
| Memory Amount (GB): | 8 |
| # and size of DIMM: | 4 x 2048 MB |
| Memory Details: | 2GB 2Rx8 PC3-10600E ECC CL9; slots B1, C1, E1, F1 populated |
| Power Supply Quantity and Rating (W): | 1 x 400 |
| Power Supply Details: | Fujitsu Technology Solutions DPS-460GP A |
| Disk Drive: | 1 x 160GB HDD SATA (2.5", 5.4krpm) |
| Disk Controller: | Integrated SATA Controller |
| # and type of Network Interface Cards (NICs) Installed: | 2 x Intel 82576 Gigabit Network Connection (onboard) |
| NICs Enabled in Firmware / OS / Connected: | 2/1/1 |
| Network Speed (Mbit): | 1000 |
| Keyboard: | None |
| Mouse: | None |
| Monitor: | None |
| Optical Drives: | No |
| Other Hardware: | None |
| Software | |
|---|---|
| Power Management: | Enabled ("Fujitsu Enhanced Power Settings" power plan) |
| Operating System (OS): | Microsoft Windows Server 2008 R2 Enterprise |
| OS Version: | Version 6.1.7600 Build 7600 |
| Filesystem: | NTFS |
| JVM Vendor: | IBM Corporation |
| JVM Version: | IBM J9 VM (build 2.4, JRE 1.6.0 IBM J9 2.4 Windows Server 2008 amd64-64 jvmwa6460sr6-20090923_42924 (JIT enabled, AOT enabled) |
| JVM Command-line Options: | -Xaggressive -Xcompressedrefs -Xgcpolicy:gencon -Xmn1400m -Xms1550m -Xmx1550m -XlockReservation -Xnoloa -XtlhPrefetch -Xlp -Xgcthreads4 |
| JVM Affinity: | start /affinity [0x000F,0x00F0,0x0F00,0xF000] |
| JVM Instances: | 4 |
| JVM Initial Heap (MB): | 1550 |
| JVM Maximum Heap (MB): | 1550 |
| JVM Address Bits: | 64 |
| Boot Firmware Version: | 0.46 |
| Management Firmware Version: | 0.48 |
| Workload Version: | SSJ 1.2.6 |
| Director Location: | Controller |
| Other Software: | None |
| JVM Instance | ssj_ops@100% |
|---|---|
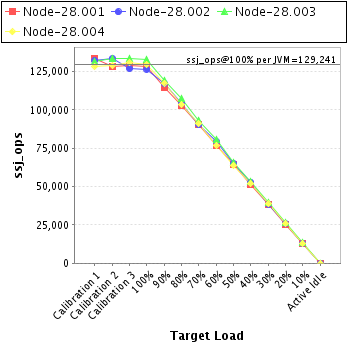
| Node-28.001 | 128,271 |
| Node-28.002 | 126,408 |
| Node-28.003 | 132,682 |
| Node-28.004 | 129,604 |
| ssj_ops@100% | 516,965 |
| ssj_ops@100% per JVM | 129,241 |
| Target Load | Actual Load | ssj_ops | |
|---|---|---|---|
| Target | Actual | ||
| Calibration 1 | 133,186 | ||
| Calibration 2 | 128,205 | ||
| Calibration 3 | 128,864 | ||
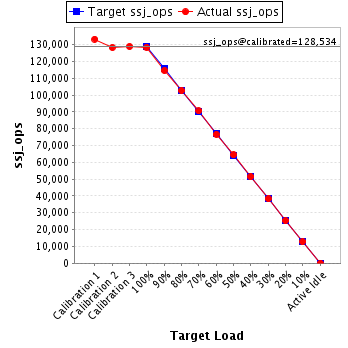
| ssj_ops@calibrated=128,534 | |||
| 100% | 99.8% | 128,534 | 128,271 |
| 90% | 89.1% | 115,681 | 114,557 |
| 80% | 79.8% | 102,827 | 102,600 |
| 70% | 70.4% | 89,974 | 90,529 |
| 60% | 59.6% | 77,121 | 76,609 |
| 50% | 50.1% | 64,267 | 64,381 |
| 40% | 40.0% | 51,414 | 51,448 |
| 30% | 29.8% | 38,560 | 38,323 |
| 20% | 19.7% | 25,707 | 25,295 |
| 10% | 10.0% | 12,853 | 12,800 |
| Active Idle | 0 | 0 | |
| Target Load | Actual Load | ssj_ops | |
|---|---|---|---|
| Target | Actual | ||
| Calibration 1 | 132,235 | ||
| Calibration 2 | 133,576 | ||
| Calibration 3 | 126,861 | ||
| ssj_ops@calibrated=130,218 | |||
| 100% | 97.1% | 130,218 | 126,408 |
| 90% | 89.8% | 117,196 | 116,991 |
| 80% | 80.0% | 104,174 | 104,191 |
| 70% | 69.3% | 91,153 | 90,300 |
| 60% | 60.8% | 78,131 | 79,178 |
| 50% | 50.0% | 65,109 | 65,147 |
| 40% | 40.7% | 52,087 | 52,949 |
| 30% | 29.6% | 39,065 | 38,608 |
| 20% | 19.8% | 26,044 | 25,746 |
| 10% | 10.0% | 13,022 | 13,021 |
| Active Idle | 0 | 0 | |

| Target Load | Actual Load | ssj_ops | |
|---|---|---|---|
| Target | Actual | ||
| Calibration 1 | 131,682 | ||
| Calibration 2 | 133,668 | ||
| Calibration 3 | 133,291 | ||
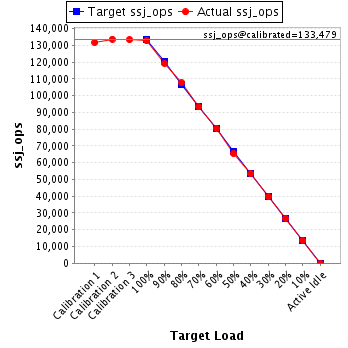
| ssj_ops@calibrated=133,479 | |||
| 100% | 99.4% | 133,479 | 132,682 |
| 90% | 89.3% | 120,132 | 119,250 |
| 80% | 80.6% | 106,784 | 107,582 |
| 70% | 69.9% | 93,436 | 93,318 |
| 60% | 60.3% | 80,088 | 80,511 |
| 50% | 49.1% | 66,740 | 65,482 |
| 40% | 40.0% | 53,392 | 53,346 |
| 30% | 29.8% | 40,044 | 39,745 |
| 20% | 20.0% | 26,696 | 26,716 |
| 10% | 10.2% | 13,348 | 13,585 |
| Active Idle | 0 | 0 | |
| Target Load | Actual Load | ssj_ops | |
|---|---|---|---|
| Target | Actual | ||
| Calibration 1 | 128,527 | ||
| Calibration 2 | 128,989 | ||
| Calibration 3 | 130,528 | ||
| ssj_ops@calibrated=129,759 | |||
| 100% | 99.9% | 129,759 | 129,604 |
| 90% | 90.5% | 116,783 | 117,464 |
| 80% | 79.8% | 103,807 | 103,486 |
| 70% | 70.1% | 90,831 | 91,021 |
| 60% | 59.3% | 77,855 | 77,003 |
| 50% | 49.1% | 64,879 | 63,762 |
| 40% | 40.1% | 51,903 | 52,007 |
| 30% | 29.9% | 38,928 | 38,738 |
| 20% | 20.2% | 25,952 | 26,169 |
| 10% | 10.0% | 12,976 | 12,916 |
| Active Idle | 0 | 0 | |
