SPECpower_ssj2008
Host 'Node-29' Performance Report
Copyright © 2007-2010 Standard Performance Evaluation Corporation
| Fujitsu PRIMERGY CX120 S1 (Intel Xeon L5530) | ssj_ops@100% = 529,726 ssj_ops@100% per JVM = 132,431 |
||||
| Test Sponsor: | Fujitsu | SPEC License #: | 19 | Test Method: | Multi Node |
| Tested By: | Fujitsu | Test Location: | Paderborn, NRW, Germany | Test Date: | Mar 7, 2010 |
| Hardware Availability: | Jun-2010 | Software Availability: | Nov-2009 | Publication: | Mar 24, 2010 |
| System Source: | Single Supplier | System Designation: | Server | Power Provisioning: | Line-powered |
| Target Load | Actual Load | ssj_ops | |
|---|---|---|---|
| Target | Actual | ||
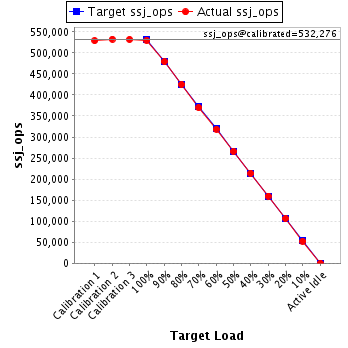
| Calibration 1 | 528,904 | ||
| Calibration 2 | 532,533 | ||
| Calibration 3 | 532,020 | ||
| ssj_ops@calibrated=532,276 | |||
| 100% | 99.5% | 532,276 | 529,726 |
| 90% | 90.0% | 479,049 | 479,218 |
| 80% | 79.8% | 425,821 | 424,822 |
| 70% | 69.5% | 372,594 | 369,723 |
| 60% | 59.9% | 319,366 | 318,622 |
| 50% | 50.0% | 266,138 | 266,250 |
| 40% | 40.2% | 212,911 | 213,832 |
| 30% | 30.0% | 159,683 | 159,766 |
| 20% | 20.0% | 106,455 | 106,345 |
| 10% | 9.9% | 53,228 | 52,711 |
| Active Idle | 0 | 0 | |
| Set Identifier: | SUT |
| Set Description: | Set of 38 identically configured PRIMERGY CX120 S1 servers |
| # of Identical Nodes: | 38 |
| Comment: | None |
| Hardware | |
|---|---|
| Hardware Vendor: | Fujitsu |
| Model: | PRIMERGY CX120 S1 (Intel Xeon L5530) |
| Form Factor: | 1U |
| CPU Name: | Intel Xeon L5530 |
| CPU Characteristics: | Quad-Core, 2.40GHz, 8MB L3 Cache |
| CPU Frequency (MHz): | 2400 |
| CPU(s) Enabled: | 8 cores, 2 chips, 4 cores/chip |
| Hardware Threads: | 16 (2 / core) |
| CPU(s) Orderable: | 1,2 chips |
| Primary Cache: | 32 KB I + 32 KB D on chip per core |
| Secondary Cache: | 256 KB I+D on chip per core |
| Tertiary Cache: | 8 MB I+D on chip per chip |
| Other Cache: | None |
| Memory Amount (GB): | 8 |
| # and size of DIMM: | 4 x 2048 MB |
| Memory Details: | 2GB 2Rx8 PC3-10600E ECC CL9; slots B1, C1, E1, F1 populated |
| Power Supply Quantity and Rating (W): | 1 x 400 |
| Power Supply Details: | Fujitsu Technology Solutions DPS-460GP A |
| Disk Drive: | 1 x 160GB HDD SATA (2.5", 5.4krpm) |
| Disk Controller: | Integrated SATA Controller |
| # and type of Network Interface Cards (NICs) Installed: | 2 x Intel 82576 Gigabit Network Connection (onboard) |
| NICs Enabled in Firmware / OS / Connected: | 2/1/1 |
| Network Speed (Mbit): | 1000 |
| Keyboard: | None |
| Mouse: | None |
| Monitor: | None |
| Optical Drives: | No |
| Other Hardware: | None |
| Software | |
|---|---|
| Power Management: | Enabled ("Fujitsu Enhanced Power Settings" power plan) |
| Operating System (OS): | Microsoft Windows Server 2008 R2 Enterprise |
| OS Version: | Version 6.1.7600 Build 7600 |
| Filesystem: | NTFS |
| JVM Vendor: | IBM Corporation |
| JVM Version: | IBM J9 VM (build 2.4, JRE 1.6.0 IBM J9 2.4 Windows Server 2008 amd64-64 jvmwa6460sr6-20090923_42924 (JIT enabled, AOT enabled) |
| JVM Command-line Options: | -Xaggressive -Xcompressedrefs -Xgcpolicy:gencon -Xmn1400m -Xms1550m -Xmx1550m -XlockReservation -Xnoloa -XtlhPrefetch -Xlp -Xgcthreads4 |
| JVM Affinity: | start /affinity [0x000F,0x00F0,0x0F00,0xF000] |
| JVM Instances: | 4 |
| JVM Initial Heap (MB): | 1550 |
| JVM Maximum Heap (MB): | 1550 |
| JVM Address Bits: | 64 |
| Boot Firmware Version: | 0.46 |
| Management Firmware Version: | 0.48 |
| Workload Version: | SSJ 1.2.6 |
| Director Location: | Controller |
| Other Software: | None |
| JVM Instance | ssj_ops@100% |
|---|---|
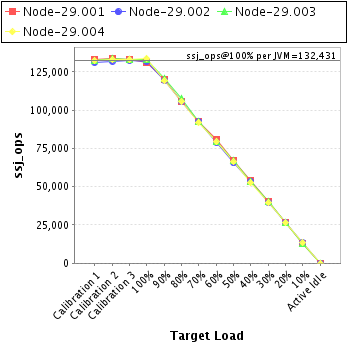
| Node-29.001 | 131,360 |
| Node-29.002 | 131,871 |
| Node-29.003 | 132,968 |
| Node-29.004 | 133,527 |
| ssj_ops@100% | 529,726 |
| ssj_ops@100% per JVM | 132,431 |
| Target Load | Actual Load | ssj_ops | |
|---|---|---|---|
| Target | Actual | ||
| Calibration 1 | 133,177 | ||
| Calibration 2 | 133,506 | ||
| Calibration 3 | 132,912 | ||
| ssj_ops@calibrated=133,209 | |||
| 100% | 98.6% | 133,209 | 131,360 |
| 90% | 90.1% | 119,888 | 119,973 |
| 80% | 79.4% | 106,567 | 105,796 |
| 70% | 69.4% | 93,246 | 92,408 |
| 60% | 60.5% | 79,925 | 80,640 |
| 50% | 50.6% | 66,605 | 67,401 |
| 40% | 40.6% | 53,284 | 54,019 |
| 30% | 30.4% | 39,963 | 40,473 |
| 20% | 20.0% | 26,642 | 26,700 |
| 10% | 9.8% | 13,321 | 12,999 |
| Active Idle | 0 | 0 | |

| Target Load | Actual Load | ssj_ops | |
|---|---|---|---|
| Target | Actual | ||
| Calibration 1 | 131,160 | ||
| Calibration 2 | 132,034 | ||
| Calibration 3 | 132,444 | ||
| ssj_ops@calibrated=132,239 | |||
| 100% | 99.7% | 132,239 | 131,871 |
| 90% | 90.4% | 119,015 | 119,515 |
| 80% | 79.9% | 105,791 | 105,667 |
| 70% | 70.0% | 92,567 | 92,625 |
| 60% | 59.6% | 79,343 | 78,866 |
| 50% | 49.5% | 66,119 | 65,511 |
| 40% | 40.5% | 52,896 | 53,517 |
| 30% | 29.9% | 39,672 | 39,521 |
| 20% | 20.0% | 26,448 | 26,473 |
| 10% | 10.0% | 13,224 | 13,242 |
| Active Idle | 0 | 0 | |

| Target Load | Actual Load | ssj_ops | |
|---|---|---|---|
| Target | Actual | ||
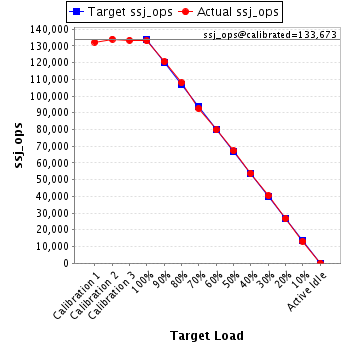
| Calibration 1 | 132,291 | ||
| Calibration 2 | 133,994 | ||
| Calibration 3 | 133,352 | ||
| ssj_ops@calibrated=133,673 | |||
| 100% | 99.5% | 133,673 | 132,968 |
| 90% | 90.2% | 120,305 | 120,551 |
| 80% | 80.7% | 106,938 | 107,887 |
| 70% | 69.2% | 93,571 | 92,546 |
| 60% | 59.7% | 80,204 | 79,781 |
| 50% | 50.2% | 66,836 | 67,155 |
| 40% | 40.2% | 53,469 | 53,734 |
| 30% | 30.2% | 40,102 | 40,352 |
| 20% | 20.0% | 26,735 | 26,717 |
| 10% | 9.9% | 13,367 | 13,196 |
| Active Idle | 0 | 0 | |
| Target Load | Actual Load | ssj_ops | |
|---|---|---|---|
| Target | Actual | ||
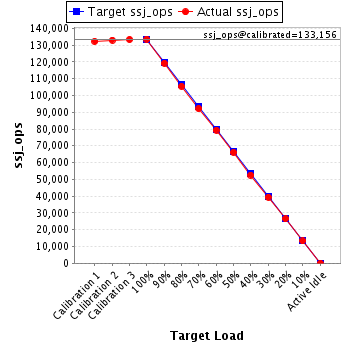
| Calibration 1 | 132,276 | ||
| Calibration 2 | 132,998 | ||
| Calibration 3 | 133,314 | ||
| ssj_ops@calibrated=133,156 | |||
| 100% | 100.3% | 133,156 | 133,527 |
| 90% | 89.5% | 119,840 | 119,179 |
| 80% | 79.2% | 106,525 | 105,472 |
| 70% | 69.2% | 93,209 | 92,144 |
| 60% | 59.6% | 79,894 | 79,335 |
| 50% | 49.7% | 66,578 | 66,184 |
| 40% | 39.5% | 53,262 | 52,562 |
| 30% | 29.6% | 39,947 | 39,420 |
| 20% | 19.9% | 26,631 | 26,455 |
| 10% | 10.0% | 13,316 | 13,275 |
| Active Idle | 0 | 0 | |