SPECpower_ssj2008
Host 'Node-3' Performance Report
Copyright © 2007-2010 Standard Performance Evaluation Corporation
| Fujitsu PRIMERGY CX120 S1 (Intel Xeon L5530) | ssj_ops@100% = 527,571 ssj_ops@100% per JVM = 131,893 |
||||
| Test Sponsor: | Fujitsu | SPEC License #: | 19 | Test Method: | Multi Node |
| Tested By: | Fujitsu | Test Location: | Paderborn, NRW, Germany | Test Date: | Mar 7, 2010 |
| Hardware Availability: | Jun-2010 | Software Availability: | Nov-2009 | Publication: | Mar 24, 2010 |
| System Source: | Single Supplier | System Designation: | Server | Power Provisioning: | Line-powered |
| Target Load | Actual Load | ssj_ops | |
|---|---|---|---|
| Target | Actual | ||
| Calibration 1 | 532,093 | ||
| Calibration 2 | 533,561 | ||
| Calibration 3 | 530,165 | ||
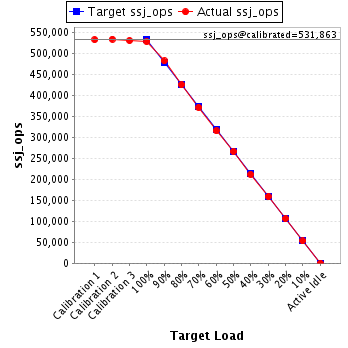
| ssj_ops@calibrated=531,863 | |||
| 100% | 99.2% | 531,863 | 527,571 |
| 90% | 90.6% | 478,677 | 481,639 |
| 80% | 79.8% | 425,490 | 424,611 |
| 70% | 69.7% | 372,304 | 370,926 |
| 60% | 59.3% | 319,118 | 315,313 |
| 50% | 50.1% | 265,931 | 266,536 |
| 40% | 39.7% | 212,745 | 211,353 |
| 30% | 29.8% | 159,559 | 158,598 |
| 20% | 19.9% | 106,373 | 105,890 |
| 10% | 10.0% | 53,186 | 53,017 |
| Active Idle | 0 | 0 | |
| Set Identifier: | SUT |
| Set Description: | Set of 38 identically configured PRIMERGY CX120 S1 servers |
| # of Identical Nodes: | 38 |
| Comment: | None |
| Hardware | |
|---|---|
| Hardware Vendor: | Fujitsu |
| Model: | PRIMERGY CX120 S1 (Intel Xeon L5530) |
| Form Factor: | 1U |
| CPU Name: | Intel Xeon L5530 |
| CPU Characteristics: | Quad-Core, 2.40GHz, 8MB L3 Cache |
| CPU Frequency (MHz): | 2400 |
| CPU(s) Enabled: | 8 cores, 2 chips, 4 cores/chip |
| Hardware Threads: | 16 (2 / core) |
| CPU(s) Orderable: | 1,2 chips |
| Primary Cache: | 32 KB I + 32 KB D on chip per core |
| Secondary Cache: | 256 KB I+D on chip per core |
| Tertiary Cache: | 8 MB I+D on chip per chip |
| Other Cache: | None |
| Memory Amount (GB): | 8 |
| # and size of DIMM: | 4 x 2048 MB |
| Memory Details: | 2GB 2Rx8 PC3-10600E ECC CL9; slots B1, C1, E1, F1 populated |
| Power Supply Quantity and Rating (W): | 1 x 400 |
| Power Supply Details: | Fujitsu Technology Solutions DPS-460GP A |
| Disk Drive: | 1 x 160GB HDD SATA (2.5", 5.4krpm) |
| Disk Controller: | Integrated SATA Controller |
| # and type of Network Interface Cards (NICs) Installed: | 2 x Intel 82576 Gigabit Network Connection (onboard) |
| NICs Enabled in Firmware / OS / Connected: | 2/1/1 |
| Network Speed (Mbit): | 1000 |
| Keyboard: | None |
| Mouse: | None |
| Monitor: | None |
| Optical Drives: | No |
| Other Hardware: | None |
| Software | |
|---|---|
| Power Management: | Enabled ("Fujitsu Enhanced Power Settings" power plan) |
| Operating System (OS): | Microsoft Windows Server 2008 R2 Enterprise |
| OS Version: | Version 6.1.7600 Build 7600 |
| Filesystem: | NTFS |
| JVM Vendor: | IBM Corporation |
| JVM Version: | IBM J9 VM (build 2.4, JRE 1.6.0 IBM J9 2.4 Windows Server 2008 amd64-64 jvmwa6460sr6-20090923_42924 (JIT enabled, AOT enabled) |
| JVM Command-line Options: | -Xaggressive -Xcompressedrefs -Xgcpolicy:gencon -Xmn1400m -Xms1550m -Xmx1550m -XlockReservation -Xnoloa -XtlhPrefetch -Xlp -Xgcthreads4 |
| JVM Affinity: | start /affinity [0x000F,0x00F0,0x0F00,0xF000] |
| JVM Instances: | 4 |
| JVM Initial Heap (MB): | 1550 |
| JVM Maximum Heap (MB): | 1550 |
| JVM Address Bits: | 64 |
| Boot Firmware Version: | 0.46 |
| Management Firmware Version: | 0.48 |
| Workload Version: | SSJ 1.2.6 |
| Director Location: | Controller |
| Other Software: | None |
| JVM Instance | ssj_ops@100% |
|---|---|
| Node-31.001 | 128,372 |
| Node-31.002 | 134,959 |
| Node-31.003 | 131,144 |
| Node-31.004 | 133,097 |
| ssj_ops@100% | 527,571 |
| ssj_ops@100% per JVM | 131,893 |

| Target Load | Actual Load | ssj_ops | |
|---|---|---|---|
| Target | Actual | ||
| Calibration 1 | 133,818 | ||
| Calibration 2 | 133,534 | ||
| Calibration 3 | 128,559 | ||
| ssj_ops@calibrated=131,047 | |||
| 100% | 98.0% | 131,047 | 128,372 |
| 90% | 90.0% | 117,942 | 117,913 |
| 80% | 80.7% | 104,837 | 105,739 |
| 70% | 69.8% | 91,733 | 91,526 |
| 60% | 58.7% | 78,628 | 76,903 |
| 50% | 50.1% | 65,523 | 65,634 |
| 40% | 39.9% | 52,419 | 52,241 |
| 30% | 29.8% | 39,314 | 39,027 |
| 20% | 19.9% | 26,209 | 26,104 |
| 10% | 9.9% | 13,105 | 12,939 |
| Active Idle | 0 | 0 | |

| Target Load | Actual Load | ssj_ops | |
|---|---|---|---|
| Target | Actual | ||
| Calibration 1 | 134,344 | ||
| Calibration 2 | 135,347 | ||
| Calibration 3 | 135,944 | ||
| ssj_ops@calibrated=135,646 | |||
| 100% | 99.5% | 135,646 | 134,959 |
| 90% | 91.0% | 122,081 | 123,473 |
| 80% | 79.1% | 108,516 | 107,255 |
| 70% | 69.7% | 94,952 | 94,538 |
| 60% | 58.8% | 81,387 | 79,822 |
| 50% | 50.3% | 67,823 | 68,253 |
| 40% | 40.1% | 54,258 | 54,329 |
| 30% | 29.8% | 40,694 | 40,467 |
| 20% | 19.9% | 27,129 | 27,058 |
| 10% | 10.3% | 13,565 | 13,937 |
| Active Idle | 0 | 0 | |

| Target Load | Actual Load | ssj_ops | |
|---|---|---|---|
| Target | Actual | ||
| Calibration 1 | 131,448 | ||
| Calibration 2 | 131,656 | ||
| Calibration 3 | 132,330 | ||
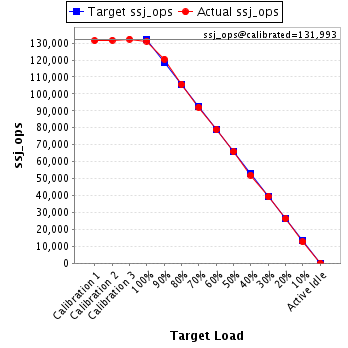
| ssj_ops@calibrated=131,993 | |||
| 100% | 99.4% | 131,993 | 131,144 |
| 90% | 91.3% | 118,794 | 120,522 |
| 80% | 80.0% | 105,594 | 105,626 |
| 70% | 69.8% | 92,395 | 92,122 |
| 60% | 59.8% | 79,196 | 78,911 |
| 50% | 49.9% | 65,996 | 65,843 |
| 40% | 39.4% | 52,797 | 52,030 |
| 30% | 29.8% | 39,598 | 39,315 |
| 20% | 19.9% | 26,399 | 26,258 |
| 10% | 9.6% | 13,199 | 12,733 |
| Active Idle | 0 | 0 | |
| Target Load | Actual Load | ssj_ops | |
|---|---|---|---|
| Target | Actual | ||
| Calibration 1 | 132,483 | ||
| Calibration 2 | 133,024 | ||
| Calibration 3 | 133,332 | ||
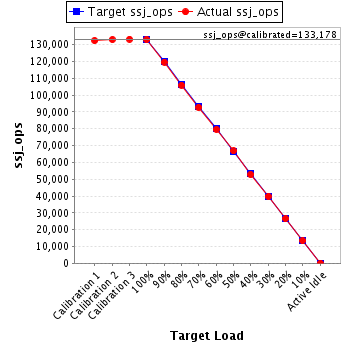
| ssj_ops@calibrated=133,178 | |||
| 100% | 99.9% | 133,178 | 133,097 |
| 90% | 89.9% | 119,860 | 119,731 |
| 80% | 79.6% | 106,542 | 105,991 |
| 70% | 69.6% | 93,224 | 92,739 |
| 60% | 59.8% | 79,907 | 79,677 |
| 50% | 50.2% | 66,589 | 66,806 |
| 40% | 39.6% | 53,271 | 52,754 |
| 30% | 29.9% | 39,953 | 39,789 |
| 20% | 19.9% | 26,636 | 26,470 |
| 10% | 10.1% | 13,318 | 13,408 |
| Active Idle | 0 | 0 | |