SPECpower_ssj2008
Host 'Node-30' Performance Report
Copyright © 2007-2010 Standard Performance Evaluation Corporation
| Fujitsu PRIMERGY CX120 S1 (Intel Xeon L5530) | ssj_ops@100% = 524,669 ssj_ops@100% per JVM = 131,167 |
||||
| Test Sponsor: | Fujitsu | SPEC License #: | 19 | Test Method: | Multi Node |
| Tested By: | Fujitsu | Test Location: | Paderborn, NRW, Germany | Test Date: | Mar 7, 2010 |
| Hardware Availability: | Jun-2010 | Software Availability: | Nov-2009 | Publication: | Mar 24, 2010 |
| System Source: | Single Supplier | System Designation: | Server | Power Provisioning: | Line-powered |
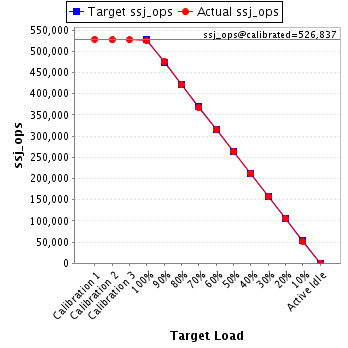
| Target Load | Actual Load | ssj_ops | |
|---|---|---|---|
| Target | Actual | ||
| Calibration 1 | 528,592 | ||
| Calibration 2 | 526,689 | ||
| Calibration 3 | 526,985 | ||
| ssj_ops@calibrated=526,837 | |||
| 100% | 99.6% | 526,837 | 524,669 |
| 90% | 90.1% | 474,153 | 474,828 |
| 80% | 79.9% | 421,470 | 421,061 |
| 70% | 69.8% | 368,786 | 367,961 |
| 60% | 59.9% | 316,102 | 315,394 |
| 50% | 49.8% | 263,418 | 262,597 |
| 40% | 40.1% | 210,735 | 211,082 |
| 30% | 29.9% | 158,051 | 157,440 |
| 20% | 20.0% | 105,367 | 105,475 |
| 10% | 9.9% | 52,684 | 52,278 |
| Active Idle | 0 | 0 | |
| Set Identifier: | SUT |
| Set Description: | Set of 38 identically configured PRIMERGY CX120 S1 servers |
| # of Identical Nodes: | 38 |
| Comment: | None |
| Hardware | |
|---|---|
| Hardware Vendor: | Fujitsu |
| Model: | PRIMERGY CX120 S1 (Intel Xeon L5530) |
| Form Factor: | 1U |
| CPU Name: | Intel Xeon L5530 |
| CPU Characteristics: | Quad-Core, 2.40GHz, 8MB L3 Cache |
| CPU Frequency (MHz): | 2400 |
| CPU(s) Enabled: | 8 cores, 2 chips, 4 cores/chip |
| Hardware Threads: | 16 (2 / core) |
| CPU(s) Orderable: | 1,2 chips |
| Primary Cache: | 32 KB I + 32 KB D on chip per core |
| Secondary Cache: | 256 KB I+D on chip per core |
| Tertiary Cache: | 8 MB I+D on chip per chip |
| Other Cache: | None |
| Memory Amount (GB): | 8 |
| # and size of DIMM: | 4 x 2048 MB |
| Memory Details: | 2GB 2Rx8 PC3-10600E ECC CL9; slots B1, C1, E1, F1 populated |
| Power Supply Quantity and Rating (W): | 1 x 400 |
| Power Supply Details: | Fujitsu Technology Solutions DPS-460GP A |
| Disk Drive: | 1 x 160GB HDD SATA (2.5", 5.4krpm) |
| Disk Controller: | Integrated SATA Controller |
| # and type of Network Interface Cards (NICs) Installed: | 2 x Intel 82576 Gigabit Network Connection (onboard) |
| NICs Enabled in Firmware / OS / Connected: | 2/1/1 |
| Network Speed (Mbit): | 1000 |
| Keyboard: | None |
| Mouse: | None |
| Monitor: | None |
| Optical Drives: | No |
| Other Hardware: | None |
| Software | |
|---|---|
| Power Management: | Enabled ("Fujitsu Enhanced Power Settings" power plan) |
| Operating System (OS): | Microsoft Windows Server 2008 R2 Enterprise |
| OS Version: | Version 6.1.7600 Build 7600 |
| Filesystem: | NTFS |
| JVM Vendor: | IBM Corporation |
| JVM Version: | IBM J9 VM (build 2.4, JRE 1.6.0 IBM J9 2.4 Windows Server 2008 amd64-64 jvmwa6460sr6-20090923_42924 (JIT enabled, AOT enabled) |
| JVM Command-line Options: | -Xaggressive -Xcompressedrefs -Xgcpolicy:gencon -Xmn1400m -Xms1550m -Xmx1550m -XlockReservation -Xnoloa -XtlhPrefetch -Xlp -Xgcthreads4 |
| JVM Affinity: | start /affinity [0x000F,0x00F0,0x0F00,0xF000] |
| JVM Instances: | 4 |
| JVM Initial Heap (MB): | 1550 |
| JVM Maximum Heap (MB): | 1550 |
| JVM Address Bits: | 64 |
| Boot Firmware Version: | 0.46 |
| Management Firmware Version: | 0.48 |
| Workload Version: | SSJ 1.2.6 |
| Director Location: | Controller |
| Other Software: | None |
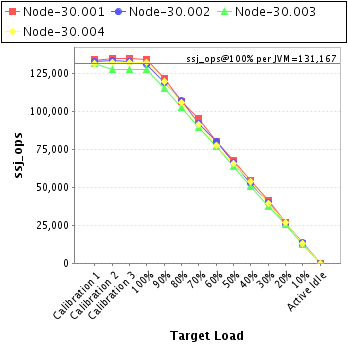
| JVM Instance | ssj_ops@100% |
|---|---|
| Node-30.001 | 134,185 |
| Node-30.002 | 130,986 |
| Node-30.003 | 127,636 |
| Node-30.004 | 131,862 |
| ssj_ops@100% | 524,669 |
| ssj_ops@100% per JVM | 131,167 |
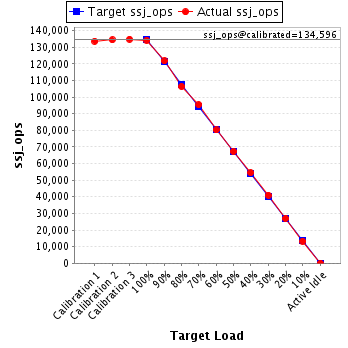
| Target Load | Actual Load | ssj_ops | |
|---|---|---|---|
| Target | Actual | ||
| Calibration 1 | 133,646 | ||
| Calibration 2 | 134,350 | ||
| Calibration 3 | 134,842 | ||
| ssj_ops@calibrated=134,596 | |||
| 100% | 99.7% | 134,596 | 134,185 |
| 90% | 90.4% | 121,137 | 121,708 |
| 80% | 79.0% | 107,677 | 106,398 |
| 70% | 70.9% | 94,217 | 95,388 |
| 60% | 59.6% | 80,758 | 80,205 |
| 50% | 50.1% | 67,298 | 67,374 |
| 40% | 40.5% | 53,839 | 54,461 |
| 30% | 30.5% | 40,379 | 41,033 |
| 20% | 20.1% | 26,919 | 26,987 |
| 10% | 9.9% | 13,460 | 13,304 |
| Active Idle | 0 | 0 | |
| Target Load | Actual Load | ssj_ops | |
|---|---|---|---|
| Target | Actual | ||
| Calibration 1 | 132,364 | ||
| Calibration 2 | 133,024 | ||
| Calibration 3 | 132,795 | ||
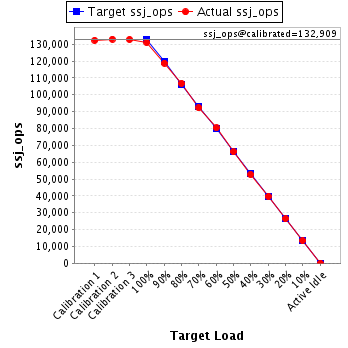
| ssj_ops@calibrated=132,909 | |||
| 100% | 98.6% | 132,909 | 130,986 |
| 90% | 89.4% | 119,618 | 118,792 |
| 80% | 80.4% | 106,328 | 106,881 |
| 70% | 69.4% | 93,037 | 92,211 |
| 60% | 60.5% | 79,746 | 80,353 |
| 50% | 49.8% | 66,455 | 66,142 |
| 40% | 39.6% | 53,164 | 52,608 |
| 30% | 29.9% | 39,873 | 39,686 |
| 20% | 19.9% | 26,582 | 26,391 |
| 10% | 10.1% | 13,291 | 13,458 |
| Active Idle | 0 | 0 | |
| Target Load | Actual Load | ssj_ops | |
|---|---|---|---|
| Target | Actual | ||
| Calibration 1 | 131,533 | ||
| Calibration 2 | 127,073 | ||
| Calibration 3 | 127,485 | ||
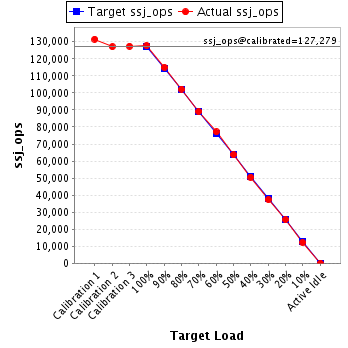
| ssj_ops@calibrated=127,279 | |||
| 100% | 100.3% | 127,279 | 127,636 |
| 90% | 90.3% | 114,551 | 114,942 |
| 80% | 80.3% | 101,823 | 102,250 |
| 70% | 70.0% | 89,095 | 89,113 |
| 60% | 60.6% | 76,367 | 77,086 |
| 50% | 50.0% | 63,640 | 63,621 |
| 40% | 39.7% | 50,912 | 50,582 |
| 30% | 29.3% | 38,184 | 37,319 |
| 20% | 20.1% | 25,456 | 25,573 |
| 10% | 9.7% | 12,728 | 12,325 |
| Active Idle | 0 | 0 | |
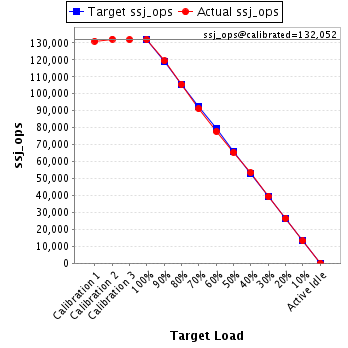
| Target Load | Actual Load | ssj_ops | |
|---|---|---|---|
| Target | Actual | ||
| Calibration 1 | 131,050 | ||
| Calibration 2 | 132,242 | ||
| Calibration 3 | 131,862 | ||
| ssj_ops@calibrated=132,052 | |||
| 100% | 99.9% | 132,052 | 131,862 |
| 90% | 90.4% | 118,847 | 119,386 |
| 80% | 79.9% | 105,642 | 105,532 |
| 70% | 69.1% | 92,436 | 91,249 |
| 60% | 58.9% | 79,231 | 77,749 |
| 50% | 49.6% | 66,026 | 65,459 |
| 40% | 40.5% | 52,821 | 53,431 |
| 30% | 29.8% | 39,616 | 39,402 |
| 20% | 20.1% | 26,410 | 26,523 |
| 10% | 10.0% | 13,205 | 13,191 |
| Active Idle | 0 | 0 | |