SPECpower_ssj2008
Host 'Node-34' Performance Report
Copyright © 2007-2010 Standard Performance Evaluation Corporation
| Fujitsu PRIMERGY CX120 S1 (Intel Xeon L5530) | ssj_ops@100% = 534,839 ssj_ops@100% per JVM = 133,710 |
||||
| Test Sponsor: | Fujitsu | SPEC License #: | 19 | Test Method: | Multi Node |
| Tested By: | Fujitsu | Test Location: | Paderborn, NRW, Germany | Test Date: | Mar 7, 2010 |
| Hardware Availability: | Jun-2010 | Software Availability: | Nov-2009 | Publication: | Mar 24, 2010 |
| System Source: | Single Supplier | System Designation: | Server | Power Provisioning: | Line-powered |
| Target Load | Actual Load | ssj_ops | |
|---|---|---|---|
| Target | Actual | ||
| Calibration 1 | 532,581 | ||
| Calibration 2 | 535,214 | ||
| Calibration 3 | 536,254 | ||
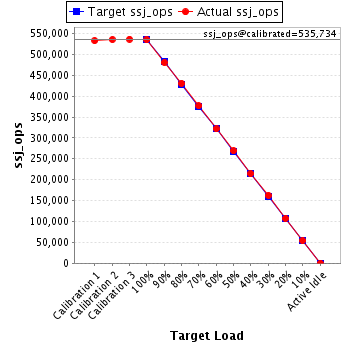
| ssj_ops@calibrated=535,734 | |||
| 100% | 99.8% | 535,734 | 534,839 |
| 90% | 89.7% | 482,161 | 480,387 |
| 80% | 80.4% | 428,587 | 430,855 |
| 70% | 70.3% | 375,014 | 376,522 |
| 60% | 60.0% | 321,440 | 321,494 |
| 50% | 50.2% | 267,867 | 268,979 |
| 40% | 40.0% | 214,294 | 214,116 |
| 30% | 30.3% | 160,720 | 162,442 |
| 20% | 20.0% | 107,147 | 107,371 |
| 10% | 10.1% | 53,573 | 54,129 |
| Active Idle | 0 | 0 | |
| Set Identifier: | SUT |
| Set Description: | Set of 38 identically configured PRIMERGY CX120 S1 servers |
| # of Identical Nodes: | 38 |
| Comment: | None |
| Hardware | |
|---|---|
| Hardware Vendor: | Fujitsu |
| Model: | PRIMERGY CX120 S1 (Intel Xeon L5530) |
| Form Factor: | 1U |
| CPU Name: | Intel Xeon L5530 |
| CPU Characteristics: | Quad-Core, 2.40GHz, 8MB L3 Cache |
| CPU Frequency (MHz): | 2400 |
| CPU(s) Enabled: | 8 cores, 2 chips, 4 cores/chip |
| Hardware Threads: | 16 (2 / core) |
| CPU(s) Orderable: | 1,2 chips |
| Primary Cache: | 32 KB I + 32 KB D on chip per core |
| Secondary Cache: | 256 KB I+D on chip per core |
| Tertiary Cache: | 8 MB I+D on chip per chip |
| Other Cache: | None |
| Memory Amount (GB): | 8 |
| # and size of DIMM: | 4 x 2048 MB |
| Memory Details: | 2GB 2Rx8 PC3-10600E ECC CL9; slots B1, C1, E1, F1 populated |
| Power Supply Quantity and Rating (W): | 1 x 400 |
| Power Supply Details: | Fujitsu Technology Solutions DPS-460GP A |
| Disk Drive: | 1 x 160GB HDD SATA (2.5", 5.4krpm) |
| Disk Controller: | Integrated SATA Controller |
| # and type of Network Interface Cards (NICs) Installed: | 2 x Intel 82576 Gigabit Network Connection (onboard) |
| NICs Enabled in Firmware / OS / Connected: | 2/1/1 |
| Network Speed (Mbit): | 1000 |
| Keyboard: | None |
| Mouse: | None |
| Monitor: | None |
| Optical Drives: | No |
| Other Hardware: | None |
| Software | |
|---|---|
| Power Management: | Enabled ("Fujitsu Enhanced Power Settings" power plan) |
| Operating System (OS): | Microsoft Windows Server 2008 R2 Enterprise |
| OS Version: | Version 6.1.7600 Build 7600 |
| Filesystem: | NTFS |
| JVM Vendor: | IBM Corporation |
| JVM Version: | IBM J9 VM (build 2.4, JRE 1.6.0 IBM J9 2.4 Windows Server 2008 amd64-64 jvmwa6460sr6-20090923_42924 (JIT enabled, AOT enabled) |
| JVM Command-line Options: | -Xaggressive -Xcompressedrefs -Xgcpolicy:gencon -Xmn1400m -Xms1550m -Xmx1550m -XlockReservation -Xnoloa -XtlhPrefetch -Xlp -Xgcthreads4 |
| JVM Affinity: | start /affinity [0x000F,0x00F0,0x0F00,0xF000] |
| JVM Instances: | 4 |
| JVM Initial Heap (MB): | 1550 |
| JVM Maximum Heap (MB): | 1550 |
| JVM Address Bits: | 64 |
| Boot Firmware Version: | 0.46 |
| Management Firmware Version: | 0.48 |
| Workload Version: | SSJ 1.2.6 |
| Director Location: | Controller |
| Other Software: | None |
| JVM Instance | ssj_ops@100% |
|---|---|
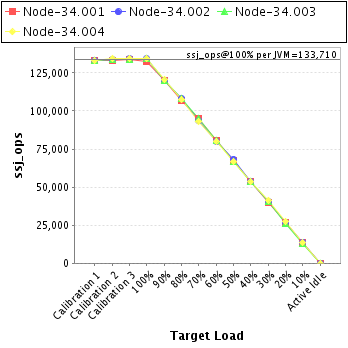
| Node-34.001 | 132,400 |
| Node-34.002 | 134,098 |
| Node-34.003 | 134,121 |
| Node-34.004 | 134,220 |
| ssj_ops@100% | 534,839 |
| ssj_ops@100% per JVM | 133,710 |
| Target Load | Actual Load | ssj_ops | |
|---|---|---|---|
| Target | Actual | ||
| Calibration 1 | 133,356 | ||
| Calibration 2 | 133,325 | ||
| Calibration 3 | 133,473 | ||
| ssj_ops@calibrated=133,399 | |||
| 100% | 99.3% | 133,399 | 132,400 |
| 90% | 89.8% | 120,059 | 119,755 |
| 80% | 80.2% | 106,719 | 107,023 |
| 70% | 71.3% | 93,379 | 95,064 |
| 60% | 60.2% | 80,039 | 80,305 |
| 50% | 50.4% | 66,700 | 67,201 |
| 40% | 40.1% | 53,360 | 53,446 |
| 30% | 29.9% | 40,020 | 39,884 |
| 20% | 19.8% | 26,680 | 26,461 |
| 10% | 10.2% | 13,340 | 13,656 |
| Active Idle | 0 | 0 | |

| Target Load | Actual Load | ssj_ops | |
|---|---|---|---|
| Target | Actual | ||
| Calibration 1 | 133,328 | ||
| Calibration 2 | 133,850 | ||
| Calibration 3 | 134,179 | ||
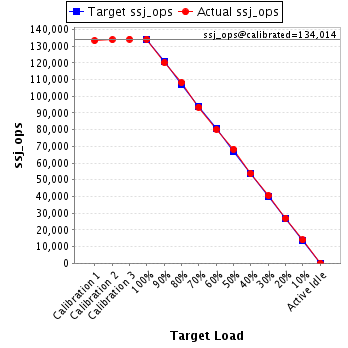
| ssj_ops@calibrated=134,014 | |||
| 100% | 100.1% | 134,014 | 134,098 |
| 90% | 89.6% | 120,613 | 120,136 |
| 80% | 80.7% | 107,212 | 108,147 |
| 70% | 69.8% | 93,810 | 93,497 |
| 60% | 59.8% | 80,409 | 80,141 |
| 50% | 51.0% | 67,007 | 68,288 |
| 40% | 40.1% | 53,606 | 53,701 |
| 30% | 30.2% | 40,204 | 40,494 |
| 20% | 20.2% | 26,803 | 27,015 |
| 10% | 10.4% | 13,401 | 13,933 |
| Active Idle | 0 | 0 | |
| Target Load | Actual Load | ssj_ops | |
|---|---|---|---|
| Target | Actual | ||
| Calibration 1 | 132,791 | ||
| Calibration 2 | 133,752 | ||
| Calibration 3 | 133,984 | ||
| ssj_ops@calibrated=133,868 | |||
| 100% | 100.2% | 133,868 | 134,121 |
| 90% | 89.8% | 120,481 | 120,153 |
| 80% | 80.8% | 107,094 | 108,193 |
| 70% | 70.9% | 93,707 | 94,855 |
| 60% | 60.4% | 80,321 | 80,827 |
| 50% | 49.8% | 66,934 | 66,600 |
| 40% | 40.0% | 53,547 | 53,612 |
| 30% | 30.3% | 40,160 | 40,603 |
| 20% | 19.7% | 26,774 | 26,359 |
| 10% | 9.7% | 13,387 | 13,045 |
| Active Idle | 0 | 0 | |

| Target Load | Actual Load | ssj_ops | |
|---|---|---|---|
| Target | Actual | ||
| Calibration 1 | 133,106 | ||
| Calibration 2 | 134,287 | ||
| Calibration 3 | 134,619 | ||
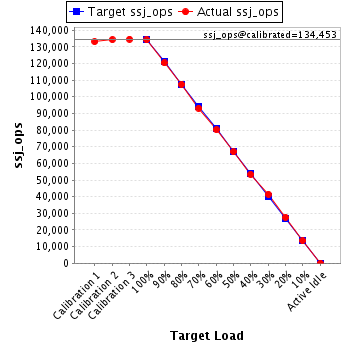
| ssj_ops@calibrated=134,453 | |||
| 100% | 99.8% | 134,453 | 134,220 |
| 90% | 89.5% | 121,007 | 120,344 |
| 80% | 79.9% | 107,562 | 107,492 |
| 70% | 69.2% | 94,117 | 93,107 |
| 60% | 59.7% | 80,672 | 80,222 |
| 50% | 49.7% | 67,226 | 66,890 |
| 40% | 39.7% | 53,781 | 53,357 |
| 30% | 30.8% | 40,336 | 41,461 |
| 20% | 20.5% | 26,891 | 27,536 |
| 10% | 10.0% | 13,445 | 13,495 |
| Active Idle | 0 | 0 | |