SPECpower_ssj2008
Host 'Node-35' Performance Report
Copyright © 2007-2010 Standard Performance Evaluation Corporation
| Fujitsu PRIMERGY CX120 S1 (Intel Xeon L5530) | ssj_ops@100% = 517,626 ssj_ops@100% per JVM = 129,406 |
||||
| Test Sponsor: | Fujitsu | SPEC License #: | 19 | Test Method: | Multi Node |
| Tested By: | Fujitsu | Test Location: | Paderborn, NRW, Germany | Test Date: | Mar 7, 2010 |
| Hardware Availability: | Jun-2010 | Software Availability: | Nov-2009 | Publication: | Mar 24, 2010 |
| System Source: | Single Supplier | System Designation: | Server | Power Provisioning: | Line-powered |
| Target Load | Actual Load | ssj_ops | |
|---|---|---|---|
| Target | Actual | ||
| Calibration 1 | 530,186 | ||
| Calibration 2 | 520,133 | ||
| Calibration 3 | 518,073 | ||
| ssj_ops@calibrated=519,103 | |||
| 100% | 99.7% | 519,103 | 517,626 |
| 90% | 89.4% | 467,193 | 464,085 |
| 80% | 80.3% | 415,283 | 417,027 |
| 70% | 70.0% | 363,372 | 363,183 |
| 60% | 60.2% | 311,462 | 312,388 |
| 50% | 49.9% | 259,552 | 259,269 |
| 40% | 40.1% | 207,641 | 208,272 |
| 30% | 29.8% | 155,731 | 154,708 |
| 20% | 19.7% | 103,821 | 102,499 |
| 10% | 9.9% | 51,910 | 51,473 |
| Active Idle | 0 | 0 | |

| Set Identifier: | SUT |
| Set Description: | Set of 38 identically configured PRIMERGY CX120 S1 servers |
| # of Identical Nodes: | 38 |
| Comment: | None |
| Hardware | |
|---|---|
| Hardware Vendor: | Fujitsu |
| Model: | PRIMERGY CX120 S1 (Intel Xeon L5530) |
| Form Factor: | 1U |
| CPU Name: | Intel Xeon L5530 |
| CPU Characteristics: | Quad-Core, 2.40GHz, 8MB L3 Cache |
| CPU Frequency (MHz): | 2400 |
| CPU(s) Enabled: | 8 cores, 2 chips, 4 cores/chip |
| Hardware Threads: | 16 (2 / core) |
| CPU(s) Orderable: | 1,2 chips |
| Primary Cache: | 32 KB I + 32 KB D on chip per core |
| Secondary Cache: | 256 KB I+D on chip per core |
| Tertiary Cache: | 8 MB I+D on chip per chip |
| Other Cache: | None |
| Memory Amount (GB): | 8 |
| # and size of DIMM: | 4 x 2048 MB |
| Memory Details: | 2GB 2Rx8 PC3-10600E ECC CL9; slots B1, C1, E1, F1 populated |
| Power Supply Quantity and Rating (W): | 1 x 400 |
| Power Supply Details: | Fujitsu Technology Solutions DPS-460GP A |
| Disk Drive: | 1 x 160GB HDD SATA (2.5", 5.4krpm) |
| Disk Controller: | Integrated SATA Controller |
| # and type of Network Interface Cards (NICs) Installed: | 2 x Intel 82576 Gigabit Network Connection (onboard) |
| NICs Enabled in Firmware / OS / Connected: | 2/1/1 |
| Network Speed (Mbit): | 1000 |
| Keyboard: | None |
| Mouse: | None |
| Monitor: | None |
| Optical Drives: | No |
| Other Hardware: | None |
| Software | |
|---|---|
| Power Management: | Enabled ("Fujitsu Enhanced Power Settings" power plan) |
| Operating System (OS): | Microsoft Windows Server 2008 R2 Enterprise |
| OS Version: | Version 6.1.7600 Build 7600 |
| Filesystem: | NTFS |
| JVM Vendor: | IBM Corporation |
| JVM Version: | IBM J9 VM (build 2.4, JRE 1.6.0 IBM J9 2.4 Windows Server 2008 amd64-64 jvmwa6460sr6-20090923_42924 (JIT enabled, AOT enabled) |
| JVM Command-line Options: | -Xaggressive -Xcompressedrefs -Xgcpolicy:gencon -Xmn1400m -Xms1550m -Xmx1550m -XlockReservation -Xnoloa -XtlhPrefetch -Xlp -Xgcthreads4 |
| JVM Affinity: | start /affinity [0x000F,0x00F0,0x0F00,0xF000] |
| JVM Instances: | 4 |
| JVM Initial Heap (MB): | 1550 |
| JVM Maximum Heap (MB): | 1550 |
| JVM Address Bits: | 64 |
| Boot Firmware Version: | 0.46 |
| Management Firmware Version: | 0.48 |
| Workload Version: | SSJ 1.2.6 |
| Director Location: | Controller |
| Other Software: | None |
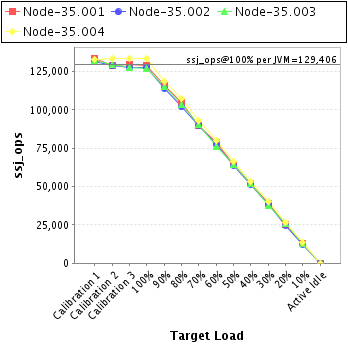
| JVM Instance | ssj_ops@100% |
|---|---|
| Node-35.001 | 128,881 |
| Node-35.002 | 127,911 |
| Node-35.003 | 127,135 |
| Node-35.004 | 133,699 |
| ssj_ops@100% | 517,626 |
| ssj_ops@100% per JVM | 129,406 |
| Target Load | Actual Load | ssj_ops | |
|---|---|---|---|
| Target | Actual | ||
| Calibration 1 | 133,383 | ||
| Calibration 2 | 128,948 | ||
| Calibration 3 | 129,347 | ||
| ssj_ops@calibrated=129,147 | |||
| 100% | 99.8% | 129,147 | 128,881 |
| 90% | 89.9% | 116,233 | 116,093 |
| 80% | 80.9% | 103,318 | 104,542 |
| 70% | 69.7% | 90,403 | 90,036 |
| 60% | 61.2% | 77,488 | 78,989 |
| 50% | 50.1% | 64,574 | 64,683 |
| 40% | 40.1% | 51,659 | 51,852 |
| 30% | 30.0% | 38,744 | 38,725 |
| 20% | 19.5% | 25,829 | 25,149 |
| 10% | 10.0% | 12,915 | 12,860 |
| Active Idle | 0 | 0 | |

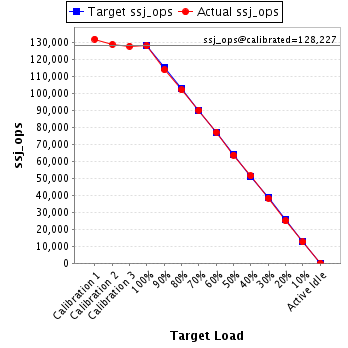
| Target Load | Actual Load | ssj_ops | |
|---|---|---|---|
| Target | Actual | ||
| Calibration 1 | 131,851 | ||
| Calibration 2 | 128,720 | ||
| Calibration 3 | 127,733 | ||
| ssj_ops@calibrated=128,227 | |||
| 100% | 99.8% | 128,227 | 127,911 |
| 90% | 88.8% | 115,404 | 113,882 |
| 80% | 79.5% | 102,581 | 101,957 |
| 70% | 70.2% | 89,759 | 90,056 |
| 60% | 60.2% | 76,936 | 77,162 |
| 50% | 49.7% | 64,113 | 63,688 |
| 40% | 40.1% | 51,291 | 51,433 |
| 30% | 29.9% | 38,468 | 38,310 |
| 20% | 19.5% | 25,645 | 24,942 |
| 10% | 9.8% | 12,823 | 12,541 |
| Active Idle | 0 | 0 | |
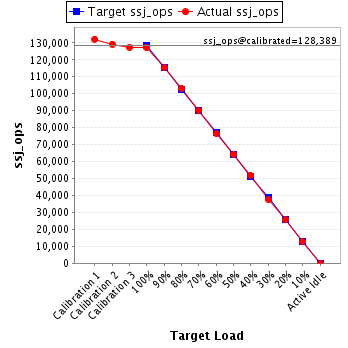
| Target Load | Actual Load | ssj_ops | |
|---|---|---|---|
| Target | Actual | ||
| Calibration 1 | 132,180 | ||
| Calibration 2 | 129,264 | ||
| Calibration 3 | 127,513 | ||
| ssj_ops@calibrated=128,389 | |||
| 100% | 99.0% | 128,389 | 127,135 |
| 90% | 89.9% | 115,550 | 115,378 |
| 80% | 80.4% | 102,711 | 103,254 |
| 70% | 70.3% | 89,872 | 90,223 |
| 60% | 59.5% | 77,033 | 76,416 |
| 50% | 50.1% | 64,194 | 64,297 |
| 40% | 40.4% | 51,355 | 51,850 |
| 30% | 29.3% | 38,517 | 37,612 |
| 20% | 20.0% | 25,678 | 25,662 |
| 10% | 9.8% | 12,839 | 12,639 |
| Active Idle | 0 | 0 | |
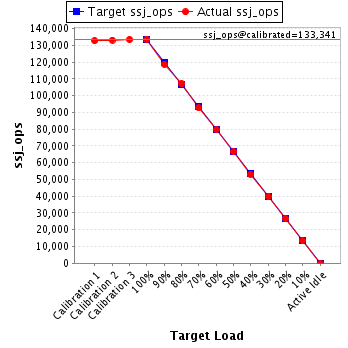
| Target Load | Actual Load | ssj_ops | |
|---|---|---|---|
| Target | Actual | ||
| Calibration 1 | 132,773 | ||
| Calibration 2 | 133,201 | ||
| Calibration 3 | 133,481 | ||
| ssj_ops@calibrated=133,341 | |||
| 100% | 100.3% | 133,341 | 133,699 |
| 90% | 89.0% | 120,007 | 118,732 |
| 80% | 80.5% | 106,673 | 107,274 |
| 70% | 69.6% | 93,338 | 92,868 |
| 60% | 59.9% | 80,004 | 79,821 |
| 50% | 49.9% | 66,670 | 66,600 |
| 40% | 39.9% | 53,336 | 53,137 |
| 30% | 30.0% | 40,002 | 40,061 |
| 20% | 20.1% | 26,668 | 26,745 |
| 10% | 10.1% | 13,334 | 13,432 |
| Active Idle | 0 | 0 | |