SPECpower_ssj2008
Host 'Node-37' Performance Report
Copyright © 2007-2010 Standard Performance Evaluation Corporation
| Fujitsu PRIMERGY CX120 S1 (Intel Xeon L5530) | ssj_ops@100% = 513,152 ssj_ops@100% per JVM = 128,288 |
||||
| Test Sponsor: | Fujitsu | SPEC License #: | 19 | Test Method: | Multi Node |
| Tested By: | Fujitsu | Test Location: | Paderborn, NRW, Germany | Test Date: | Mar 7, 2010 |
| Hardware Availability: | Jun-2010 | Software Availability: | Nov-2009 | Publication: | Mar 24, 2010 |
| System Source: | Single Supplier | System Designation: | Server | Power Provisioning: | Line-powered |
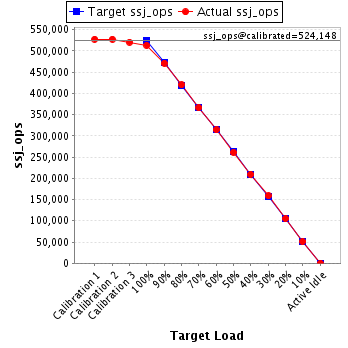
| Target Load | Actual Load | ssj_ops | |
|---|---|---|---|
| Target | Actual | ||
| Calibration 1 | 527,609 | ||
| Calibration 2 | 527,636 | ||
| Calibration 3 | 520,660 | ||
| ssj_ops@calibrated=524,148 | |||
| 100% | 97.9% | 524,148 | 513,152 |
| 90% | 89.8% | 471,733 | 470,813 |
| 80% | 80.1% | 419,318 | 419,998 |
| 70% | 69.9% | 366,904 | 366,121 |
| 60% | 60.0% | 314,489 | 314,263 |
| 50% | 49.9% | 262,074 | 261,434 |
| 40% | 40.0% | 209,659 | 209,405 |
| 30% | 30.3% | 157,244 | 158,624 |
| 20% | 20.1% | 104,830 | 105,110 |
| 10% | 9.8% | 52,415 | 51,296 |
| Active Idle | 0 | 0 | |
| Set Identifier: | SUT |
| Set Description: | Set of 38 identically configured PRIMERGY CX120 S1 servers |
| # of Identical Nodes: | 38 |
| Comment: | None |
| Hardware | |
|---|---|
| Hardware Vendor: | Fujitsu |
| Model: | PRIMERGY CX120 S1 (Intel Xeon L5530) |
| Form Factor: | 1U |
| CPU Name: | Intel Xeon L5530 |
| CPU Characteristics: | Quad-Core, 2.40GHz, 8MB L3 Cache |
| CPU Frequency (MHz): | 2400 |
| CPU(s) Enabled: | 8 cores, 2 chips, 4 cores/chip |
| Hardware Threads: | 16 (2 / core) |
| CPU(s) Orderable: | 1,2 chips |
| Primary Cache: | 32 KB I + 32 KB D on chip per core |
| Secondary Cache: | 256 KB I+D on chip per core |
| Tertiary Cache: | 8 MB I+D on chip per chip |
| Other Cache: | None |
| Memory Amount (GB): | 8 |
| # and size of DIMM: | 4 x 2048 MB |
| Memory Details: | 2GB 2Rx8 PC3-10600E ECC CL9; slots B1, C1, E1, F1 populated |
| Power Supply Quantity and Rating (W): | 1 x 400 |
| Power Supply Details: | Fujitsu Technology Solutions DPS-460GP A |
| Disk Drive: | 1 x 160GB HDD SATA (2.5", 5.4krpm) |
| Disk Controller: | Integrated SATA Controller |
| # and type of Network Interface Cards (NICs) Installed: | 2 x Intel 82576 Gigabit Network Connection (onboard) |
| NICs Enabled in Firmware / OS / Connected: | 2/1/1 |
| Network Speed (Mbit): | 1000 |
| Keyboard: | None |
| Mouse: | None |
| Monitor: | None |
| Optical Drives: | No |
| Other Hardware: | None |
| Software | |
|---|---|
| Power Management: | Enabled ("Fujitsu Enhanced Power Settings" power plan) |
| Operating System (OS): | Microsoft Windows Server 2008 R2 Enterprise |
| OS Version: | Version 6.1.7600 Build 7600 |
| Filesystem: | NTFS |
| JVM Vendor: | IBM Corporation |
| JVM Version: | IBM J9 VM (build 2.4, JRE 1.6.0 IBM J9 2.4 Windows Server 2008 amd64-64 jvmwa6460sr6-20090923_42924 (JIT enabled, AOT enabled) |
| JVM Command-line Options: | -Xaggressive -Xcompressedrefs -Xgcpolicy:gencon -Xmn1400m -Xms1550m -Xmx1550m -XlockReservation -Xnoloa -XtlhPrefetch -Xlp -Xgcthreads4 |
| JVM Affinity: | start /affinity [0x000F,0x00F0,0x0F00,0xF000] |
| JVM Instances: | 4 |
| JVM Initial Heap (MB): | 1550 |
| JVM Maximum Heap (MB): | 1550 |
| JVM Address Bits: | 64 |
| Boot Firmware Version: | 0.46 |
| Management Firmware Version: | 0.48 |
| Workload Version: | SSJ 1.2.6 |
| Director Location: | Controller |
| Other Software: | None |
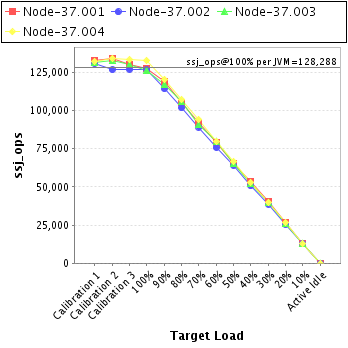
| JVM Instance | ssj_ops@100% |
|---|---|
| Node-37.001 | 127,403 |
| Node-37.002 | 126,664 |
| Node-37.003 | 126,421 |
| Node-37.004 | 132,664 |
| ssj_ops@100% | 513,152 |
| ssj_ops@100% per JVM | 128,288 |
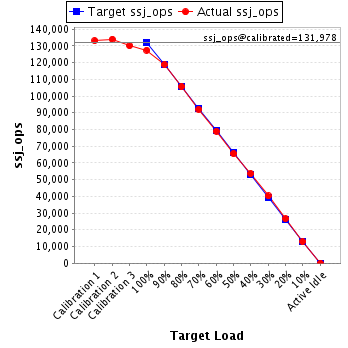
| Target Load | Actual Load | ssj_ops | |
|---|---|---|---|
| Target | Actual | ||
| Calibration 1 | 133,059 | ||
| Calibration 2 | 133,985 | ||
| Calibration 3 | 129,972 | ||
| ssj_ops@calibrated=131,978 | |||
| 100% | 96.5% | 131,978 | 127,403 |
| 90% | 90.0% | 118,780 | 118,791 |
| 80% | 80.0% | 105,583 | 105,601 |
| 70% | 69.8% | 92,385 | 92,118 |
| 60% | 59.8% | 79,187 | 78,927 |
| 50% | 49.6% | 65,989 | 65,471 |
| 40% | 40.7% | 52,791 | 53,690 |
| 30% | 30.5% | 39,593 | 40,252 |
| 20% | 20.2% | 26,396 | 26,595 |
| 10% | 9.8% | 13,198 | 12,954 |
| Active Idle | 0 | 0 | |
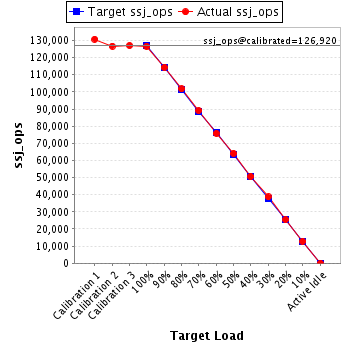
| Target Load | Actual Load | ssj_ops | |
|---|---|---|---|
| Target | Actual | ||
| Calibration 1 | 130,770 | ||
| Calibration 2 | 126,749 | ||
| Calibration 3 | 127,092 | ||
| ssj_ops@calibrated=126,920 | |||
| 100% | 99.8% | 126,920 | 126,664 |
| 90% | 90.1% | 114,228 | 114,297 |
| 80% | 80.1% | 101,536 | 101,718 |
| 70% | 70.3% | 88,844 | 89,168 |
| 60% | 59.7% | 76,152 | 75,778 |
| 50% | 50.5% | 63,460 | 64,114 |
| 40% | 39.9% | 50,768 | 50,645 |
| 30% | 30.5% | 38,076 | 38,705 |
| 20% | 20.0% | 25,384 | 25,400 |
| 10% | 10.1% | 12,692 | 12,825 |
| Active Idle | 0 | 0 | |
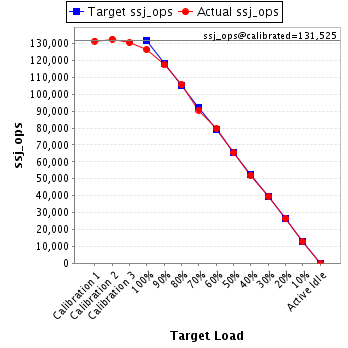
| Target Load | Actual Load | ssj_ops | |
|---|---|---|---|
| Target | Actual | ||
| Calibration 1 | 131,492 | ||
| Calibration 2 | 132,602 | ||
| Calibration 3 | 130,448 | ||
| ssj_ops@calibrated=131,525 | |||
| 100% | 96.1% | 131,525 | 126,421 |
| 90% | 89.3% | 118,372 | 117,391 |
| 80% | 80.4% | 105,220 | 105,750 |
| 70% | 68.9% | 92,067 | 90,682 |
| 60% | 60.6% | 78,915 | 79,696 |
| 50% | 49.6% | 65,762 | 65,301 |
| 40% | 39.6% | 52,610 | 52,048 |
| 30% | 30.2% | 39,457 | 39,681 |
| 20% | 20.0% | 26,305 | 26,357 |
| 10% | 9.8% | 13,152 | 12,864 |
| Active Idle | 0 | 0 | |
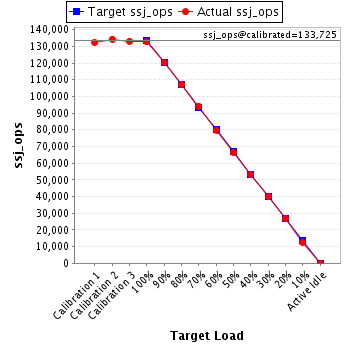
| Target Load | Actual Load | ssj_ops | |
|---|---|---|---|
| Target | Actual | ||
| Calibration 1 | 132,288 | ||
| Calibration 2 | 134,300 | ||
| Calibration 3 | 133,149 | ||
| ssj_ops@calibrated=133,725 | |||
| 100% | 99.2% | 133,725 | 132,664 |
| 90% | 90.0% | 120,352 | 120,333 |
| 80% | 80.0% | 106,980 | 106,929 |
| 70% | 70.4% | 93,607 | 94,153 |
| 60% | 59.7% | 80,235 | 79,861 |
| 50% | 49.8% | 66,862 | 66,548 |
| 40% | 39.6% | 53,490 | 53,022 |
| 30% | 29.9% | 40,117 | 39,986 |
| 20% | 20.0% | 26,745 | 26,758 |
| 10% | 9.5% | 13,372 | 12,654 |
| Active Idle | 0 | 0 | |