SPECpower_ssj2008
Host 'Node-38' Performance Report
Copyright © 2007-2010 Standard Performance Evaluation Corporation
| Fujitsu PRIMERGY CX120 S1 (Intel Xeon L5530) | ssj_ops@100% = 520,547 ssj_ops@100% per JVM = 130,137 |
||||
| Test Sponsor: | Fujitsu | SPEC License #: | 19 | Test Method: | Multi Node |
| Tested By: | Fujitsu | Test Location: | Paderborn, NRW, Germany | Test Date: | Mar 7, 2010 |
| Hardware Availability: | Jun-2010 | Software Availability: | Nov-2009 | Publication: | Mar 24, 2010 |
| System Source: | Single Supplier | System Designation: | Server | Power Provisioning: | Line-powered |
| Target Load | Actual Load | ssj_ops | |
|---|---|---|---|
| Target | Actual | ||
| Calibration 1 | 527,245 | ||
| Calibration 2 | 523,329 | ||
| Calibration 3 | 525,461 | ||
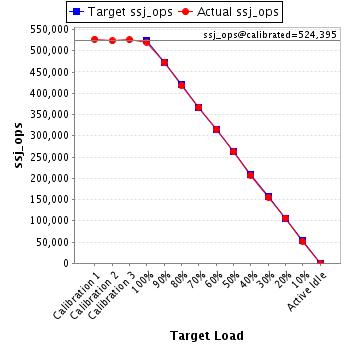
| ssj_ops@calibrated=524,395 | |||
| 100% | 99.3% | 524,395 | 520,547 |
| 90% | 89.9% | 471,955 | 471,293 |
| 80% | 79.8% | 419,516 | 418,520 |
| 70% | 70.0% | 367,076 | 366,919 |
| 60% | 60.2% | 314,637 | 315,851 |
| 50% | 50.1% | 262,197 | 262,483 |
| 40% | 39.6% | 209,758 | 207,615 |
| 30% | 29.7% | 157,318 | 155,628 |
| 20% | 20.3% | 104,879 | 106,376 |
| 10% | 9.9% | 52,439 | 52,059 |
| Active Idle | 0 | 0 | |
| Set Identifier: | SUT |
| Set Description: | Set of 38 identically configured PRIMERGY CX120 S1 servers |
| # of Identical Nodes: | 38 |
| Comment: | None |
| Hardware | |
|---|---|
| Hardware Vendor: | Fujitsu |
| Model: | PRIMERGY CX120 S1 (Intel Xeon L5530) |
| Form Factor: | 1U |
| CPU Name: | Intel Xeon L5530 |
| CPU Characteristics: | Quad-Core, 2.40GHz, 8MB L3 Cache |
| CPU Frequency (MHz): | 2400 |
| CPU(s) Enabled: | 8 cores, 2 chips, 4 cores/chip |
| Hardware Threads: | 16 (2 / core) |
| CPU(s) Orderable: | 1,2 chips |
| Primary Cache: | 32 KB I + 32 KB D on chip per core |
| Secondary Cache: | 256 KB I+D on chip per core |
| Tertiary Cache: | 8 MB I+D on chip per chip |
| Other Cache: | None |
| Memory Amount (GB): | 8 |
| # and size of DIMM: | 4 x 2048 MB |
| Memory Details: | 2GB 2Rx8 PC3-10600E ECC CL9; slots B1, C1, E1, F1 populated |
| Power Supply Quantity and Rating (W): | 1 x 400 |
| Power Supply Details: | Fujitsu Technology Solutions DPS-460GP A |
| Disk Drive: | 1 x 160GB HDD SATA (2.5", 5.4krpm) |
| Disk Controller: | Integrated SATA Controller |
| # and type of Network Interface Cards (NICs) Installed: | 2 x Intel 82576 Gigabit Network Connection (onboard) |
| NICs Enabled in Firmware / OS / Connected: | 2/1/1 |
| Network Speed (Mbit): | 1000 |
| Keyboard: | None |
| Mouse: | None |
| Monitor: | None |
| Optical Drives: | No |
| Other Hardware: | None |
| Software | |
|---|---|
| Power Management: | Enabled ("Fujitsu Enhanced Power Settings" power plan) |
| Operating System (OS): | Microsoft Windows Server 2008 R2 Enterprise |
| OS Version: | Version 6.1.7600 Build 7600 |
| Filesystem: | NTFS |
| JVM Vendor: | IBM Corporation |
| JVM Version: | IBM J9 VM (build 2.4, JRE 1.6.0 IBM J9 2.4 Windows Server 2008 amd64-64 jvmwa6460sr6-20090923_42924 (JIT enabled, AOT enabled) |
| JVM Command-line Options: | -Xaggressive -Xcompressedrefs -Xgcpolicy:gencon -Xmn1400m -Xms1550m -Xmx1550m -XlockReservation -Xnoloa -XtlhPrefetch -Xlp -Xgcthreads4 |
| JVM Affinity: | start /affinity [0x000F,0x00F0,0x0F00,0xF000] |
| JVM Instances: | 4 |
| JVM Initial Heap (MB): | 1550 |
| JVM Maximum Heap (MB): | 1550 |
| JVM Address Bits: | 64 |
| Boot Firmware Version: | 0.46 |
| Management Firmware Version: | 0.48 |
| Workload Version: | SSJ 1.2.6 |
| Director Location: | Controller |
| Other Software: | None |
| JVM Instance | ssj_ops@100% |
|---|---|
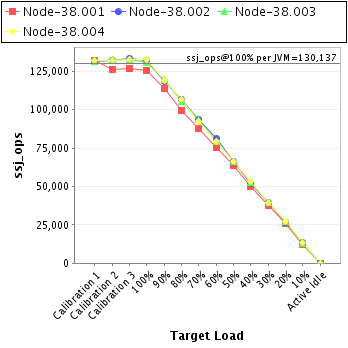
| Node-38.001 | 125,638 |
| Node-38.002 | 132,124 |
| Node-38.003 | 130,407 |
| Node-38.004 | 132,377 |
| ssj_ops@100% | 520,547 |
| ssj_ops@100% per JVM | 130,137 |
| Target Load | Actual Load | ssj_ops | |
|---|---|---|---|
| Target | Actual | ||
| Calibration 1 | 132,005 | ||
| Calibration 2 | 126,249 | ||
| Calibration 3 | 126,706 | ||
| ssj_ops@calibrated=126,478 | |||
| 100% | 99.3% | 126,478 | 125,638 |
| 90% | 90.2% | 113,830 | 114,081 |
| 80% | 78.9% | 101,182 | 99,764 |
| 70% | 69.2% | 88,535 | 87,497 |
| 60% | 59.8% | 75,887 | 75,578 |
| 50% | 50.3% | 63,239 | 63,663 |
| 40% | 39.4% | 50,591 | 49,856 |
| 30% | 29.7% | 37,943 | 37,575 |
| 20% | 20.3% | 25,296 | 25,666 |
| 10% | 9.8% | 12,648 | 12,367 |
| Active Idle | 0 | 0 | |

| Target Load | Actual Load | ssj_ops | |
|---|---|---|---|
| Target | Actual | ||
| Calibration 1 | 131,574 | ||
| Calibration 2 | 132,332 | ||
| Calibration 3 | 133,538 | ||
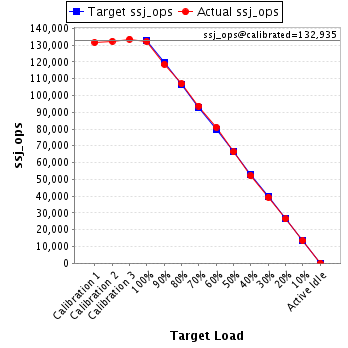
| ssj_ops@calibrated=132,935 | |||
| 100% | 99.4% | 132,935 | 132,124 |
| 90% | 89.2% | 119,642 | 118,591 |
| 80% | 80.4% | 106,348 | 106,890 |
| 70% | 70.5% | 93,055 | 93,684 |
| 60% | 61.1% | 79,761 | 81,158 |
| 50% | 49.9% | 66,468 | 66,334 |
| 40% | 39.1% | 53,174 | 52,006 |
| 30% | 29.6% | 39,881 | 39,310 |
| 20% | 19.9% | 26,587 | 26,412 |
| 10% | 10.2% | 13,294 | 13,504 |
| Active Idle | 0 | 0 | |
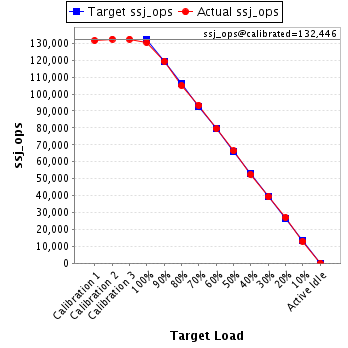
| Target Load | Actual Load | ssj_ops | |
|---|---|---|---|
| Target | Actual | ||
| Calibration 1 | 131,691 | ||
| Calibration 2 | 132,440 | ||
| Calibration 3 | 132,452 | ||
| ssj_ops@calibrated=132,446 | |||
| 100% | 98.5% | 132,446 | 130,407 |
| 90% | 90.2% | 119,202 | 119,435 |
| 80% | 79.3% | 105,957 | 105,080 |
| 70% | 70.5% | 92,712 | 93,366 |
| 60% | 60.1% | 79,468 | 79,564 |
| 50% | 50.1% | 66,223 | 66,371 |
| 40% | 39.5% | 52,978 | 52,374 |
| 30% | 29.7% | 39,734 | 39,321 |
| 20% | 20.4% | 26,489 | 27,055 |
| 10% | 9.8% | 13,245 | 12,984 |
| Active Idle | 0 | 0 | |
| Target Load | Actual Load | ssj_ops | |
|---|---|---|---|
| Target | Actual | ||
| Calibration 1 | 131,976 | ||
| Calibration 2 | 132,307 | ||
| Calibration 3 | 132,764 | ||
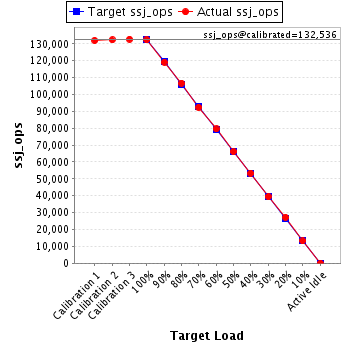
| ssj_ops@calibrated=132,536 | |||
| 100% | 99.9% | 132,536 | 132,377 |
| 90% | 89.9% | 119,282 | 119,185 |
| 80% | 80.6% | 106,028 | 106,787 |
| 70% | 69.7% | 92,775 | 92,373 |
| 60% | 60.0% | 79,521 | 79,551 |
| 50% | 49.9% | 66,268 | 66,115 |
| 40% | 40.3% | 53,014 | 53,379 |
| 30% | 29.7% | 39,761 | 39,423 |
| 20% | 20.6% | 26,507 | 27,243 |
| 10% | 10.0% | 13,254 | 13,204 |
| Active Idle | 0 | 0 | |