
SPECpower_ssj2008
Host 'Node-4' Performance Report
Copyright © 2007-2010 Standard Performance Evaluation Corporation
| Fujitsu PRIMERGY CX120 S1 (Intel Xeon L5530) | ssj_ops@100% = 527,298 ssj_ops@100% per JVM = 131,825 |
||||
| Test Sponsor: | Fujitsu | SPEC License #: | 19 | Test Method: | Multi Node |
| Tested By: | Fujitsu | Test Location: | Paderborn, NRW, Germany | Test Date: | Mar 7, 2010 |
| Hardware Availability: | Jun-2010 | Software Availability: | Nov-2009 | Publication: | Mar 24, 2010 |
| System Source: | Single Supplier | System Designation: | Server | Power Provisioning: | Line-powered |
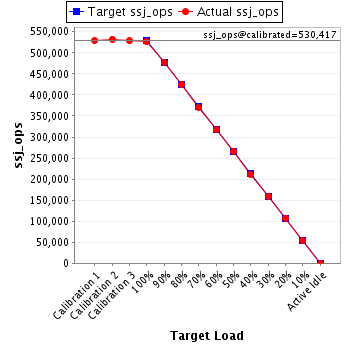
| Target Load | Actual Load | ssj_ops | |
|---|---|---|---|
| Target | Actual | ||
| Calibration 1 | 529,151 | ||
| Calibration 2 | 532,458 | ||
| Calibration 3 | 528,375 | ||
| ssj_ops@calibrated=530,417 | |||
| 100% | 99.4% | 530,417 | 527,298 |
| 90% | 90.1% | 477,375 | 477,915 |
| 80% | 80.1% | 424,333 | 424,626 |
| 70% | 69.9% | 371,292 | 370,956 |
| 60% | 59.7% | 318,250 | 316,712 |
| 50% | 50.3% | 265,208 | 266,620 |
| 40% | 39.9% | 212,167 | 211,897 |
| 30% | 30.0% | 159,125 | 159,339 |
| 20% | 20.1% | 106,083 | 106,808 |
| 10% | 10.1% | 53,042 | 53,745 |
| Active Idle | 0 | 0 | |
| Set Identifier: | SUT |
| Set Description: | Set of 38 identically configured PRIMERGY CX120 S1 servers |
| # of Identical Nodes: | 38 |
| Comment: | None |
| Hardware | |
|---|---|
| Hardware Vendor: | Fujitsu |
| Model: | PRIMERGY CX120 S1 (Intel Xeon L5530) |
| Form Factor: | 1U |
| CPU Name: | Intel Xeon L5530 |
| CPU Characteristics: | Quad-Core, 2.40GHz, 8MB L3 Cache |
| CPU Frequency (MHz): | 2400 |
| CPU(s) Enabled: | 8 cores, 2 chips, 4 cores/chip |
| Hardware Threads: | 16 (2 / core) |
| CPU(s) Orderable: | 1,2 chips |
| Primary Cache: | 32 KB I + 32 KB D on chip per core |
| Secondary Cache: | 256 KB I+D on chip per core |
| Tertiary Cache: | 8 MB I+D on chip per chip |
| Other Cache: | None |
| Memory Amount (GB): | 8 |
| # and size of DIMM: | 4 x 2048 MB |
| Memory Details: | 2GB 2Rx8 PC3-10600E ECC CL9; slots B1, C1, E1, F1 populated |
| Power Supply Quantity and Rating (W): | 1 x 400 |
| Power Supply Details: | Fujitsu Technology Solutions DPS-460GP A |
| Disk Drive: | 1 x 160GB HDD SATA (2.5", 5.4krpm) |
| Disk Controller: | Integrated SATA Controller |
| # and type of Network Interface Cards (NICs) Installed: | 2 x Intel 82576 Gigabit Network Connection (onboard) |
| NICs Enabled in Firmware / OS / Connected: | 2/1/1 |
| Network Speed (Mbit): | 1000 |
| Keyboard: | None |
| Mouse: | None |
| Monitor: | None |
| Optical Drives: | No |
| Other Hardware: | None |
| Software | |
|---|---|
| Power Management: | Enabled ("Fujitsu Enhanced Power Settings" power plan) |
| Operating System (OS): | Microsoft Windows Server 2008 R2 Enterprise |
| OS Version: | Version 6.1.7600 Build 7600 |
| Filesystem: | NTFS |
| JVM Vendor: | IBM Corporation |
| JVM Version: | IBM J9 VM (build 2.4, JRE 1.6.0 IBM J9 2.4 Windows Server 2008 amd64-64 jvmwa6460sr6-20090923_42924 (JIT enabled, AOT enabled) |
| JVM Command-line Options: | -Xaggressive -Xcompressedrefs -Xgcpolicy:gencon -Xmn1400m -Xms1550m -Xmx1550m -XlockReservation -Xnoloa -XtlhPrefetch -Xlp -Xgcthreads4 |
| JVM Affinity: | start /affinity [0x000F,0x00F0,0x0F00,0xF000] |
| JVM Instances: | 4 |
| JVM Initial Heap (MB): | 1550 |
| JVM Maximum Heap (MB): | 1550 |
| JVM Address Bits: | 64 |
| Boot Firmware Version: | 0.46 |
| Management Firmware Version: | 0.48 |
| Workload Version: | SSJ 1.2.6 |
| Director Location: | Controller |
| Other Software: | None |
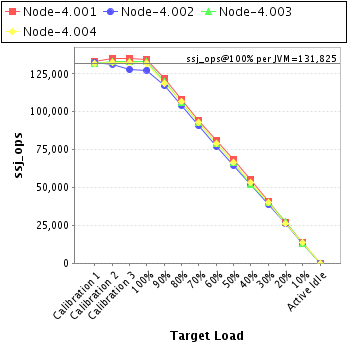
| JVM Instance | ssj_ops@100% |
|---|---|
| Node-4.001 | 134,817 |
| Node-4.002 | 127,525 |
| Node-4.003 | 132,953 |
| Node-4.004 | 132,003 |
| ssj_ops@100% | 527,298 |
| ssj_ops@100% per JVM | 131,825 |
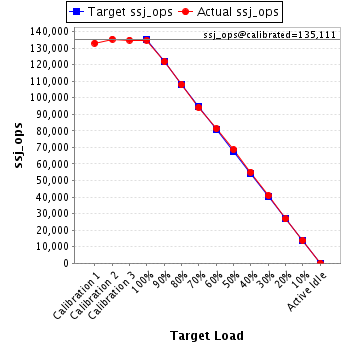
| Target Load | Actual Load | ssj_ops | |
|---|---|---|---|
| Target | Actual | ||
| Calibration 1 | 133,012 | ||
| Calibration 2 | 135,366 | ||
| Calibration 3 | 134,857 | ||
| ssj_ops@calibrated=135,111 | |||
| 100% | 99.8% | 135,111 | 134,817 |
| 90% | 90.2% | 121,600 | 121,829 |
| 80% | 79.8% | 108,089 | 107,849 |
| 70% | 69.6% | 94,578 | 94,057 |
| 60% | 60.2% | 81,067 | 81,331 |
| 50% | 50.8% | 67,556 | 68,663 |
| 40% | 40.8% | 54,044 | 55,077 |
| 30% | 30.3% | 40,533 | 40,949 |
| 20% | 19.8% | 27,022 | 26,766 |
| 10% | 10.3% | 13,511 | 13,854 |
| Active Idle | 0 | 0 | |
| Target Load | Actual Load | ssj_ops | |
|---|---|---|---|
| Target | Actual | ||
| Calibration 1 | 132,373 | ||
| Calibration 2 | 131,432 | ||
| Calibration 3 | 127,904 | ||
| ssj_ops@calibrated=129,668 | |||
| 100% | 98.3% | 129,668 | 127,525 |
| 90% | 90.4% | 116,701 | 117,277 |
| 80% | 80.3% | 103,735 | 104,136 |
| 70% | 70.0% | 90,768 | 90,735 |
| 60% | 59.6% | 77,801 | 77,249 |
| 50% | 49.8% | 64,834 | 64,585 |
| 40% | 40.1% | 51,867 | 51,971 |
| 30% | 29.8% | 38,900 | 38,693 |
| 20% | 20.2% | 25,934 | 26,162 |
| 10% | 10.0% | 12,967 | 13,012 |
| Active Idle | 0 | 0 | |

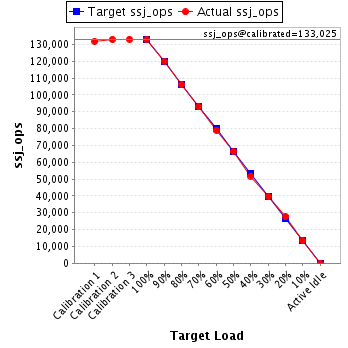
| Target Load | Actual Load | ssj_ops | |
|---|---|---|---|
| Target | Actual | ||
| Calibration 1 | 131,842 | ||
| Calibration 2 | 132,915 | ||
| Calibration 3 | 133,135 | ||
| ssj_ops@calibrated=133,025 | |||
| 100% | 99.9% | 133,025 | 132,953 |
| 90% | 90.2% | 119,723 | 120,016 |
| 80% | 79.7% | 106,420 | 106,054 |
| 70% | 70.0% | 93,118 | 93,054 |
| 60% | 59.5% | 79,815 | 79,096 |
| 50% | 50.0% | 66,513 | 66,548 |
| 40% | 39.0% | 53,210 | 51,819 |
| 30% | 29.9% | 39,908 | 39,826 |
| 20% | 20.7% | 26,605 | 27,569 |
| 10% | 10.0% | 13,303 | 13,329 |
| Active Idle | 0 | 0 | |
| Target Load | Actual Load | ssj_ops | |
|---|---|---|---|
| Target | Actual | ||
| Calibration 1 | 131,924 | ||
| Calibration 2 | 132,746 | ||
| Calibration 3 | 132,479 | ||
| ssj_ops@calibrated=132,612 | |||
| 100% | 99.5% | 132,612 | 132,003 |
| 90% | 89.6% | 119,351 | 118,793 |
| 80% | 80.4% | 106,090 | 106,587 |
| 70% | 70.2% | 92,828 | 93,110 |
| 60% | 59.6% | 79,567 | 79,035 |
| 50% | 50.4% | 66,306 | 66,824 |
| 40% | 40.0% | 53,045 | 53,030 |
| 30% | 30.1% | 39,784 | 39,871 |
| 20% | 19.8% | 26,522 | 26,310 |
| 10% | 10.2% | 13,261 | 13,550 |
| Active Idle | 0 | 0 | |
