SPECpower_ssj2008
Host 'Node-8' Performance Report
Copyright © 2007-2010 Standard Performance Evaluation Corporation
| Fujitsu PRIMERGY CX120 S1 (Intel Xeon L5530) | ssj_ops@100% = 530,791 ssj_ops@100% per JVM = 132,698 |
||||
| Test Sponsor: | Fujitsu | SPEC License #: | 19 | Test Method: | Multi Node |
| Tested By: | Fujitsu | Test Location: | Paderborn, NRW, Germany | Test Date: | Mar 7, 2010 |
| Hardware Availability: | Jun-2010 | Software Availability: | Nov-2009 | Publication: | Mar 24, 2010 |
| System Source: | Single Supplier | System Designation: | Server | Power Provisioning: | Line-powered |
| Target Load | Actual Load | ssj_ops | |
|---|---|---|---|
| Target | Actual | ||
| Calibration 1 | 529,044 | ||
| Calibration 2 | 531,865 | ||
| Calibration 3 | 531,086 | ||
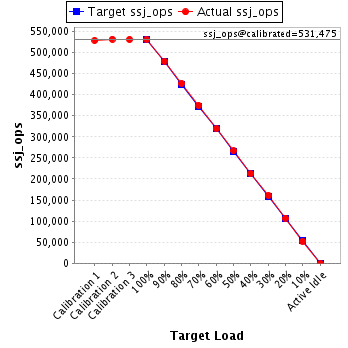
| ssj_ops@calibrated=531,475 | |||
| 100% | 99.9% | 531,475 | 530,791 |
| 90% | 90.3% | 478,328 | 479,856 |
| 80% | 80.4% | 425,180 | 427,115 |
| 70% | 70.5% | 372,033 | 374,510 |
| 60% | 60.1% | 318,885 | 319,336 |
| 50% | 50.2% | 265,738 | 266,609 |
| 40% | 40.0% | 212,590 | 212,532 |
| 30% | 30.2% | 159,443 | 160,391 |
| 20% | 20.2% | 106,295 | 107,163 |
| 10% | 9.9% | 53,148 | 52,433 |
| Active Idle | 0 | 0 | |
| Set Identifier: | SUT |
| Set Description: | Set of 38 identically configured PRIMERGY CX120 S1 servers |
| # of Identical Nodes: | 38 |
| Comment: | None |
| Hardware | |
|---|---|
| Hardware Vendor: | Fujitsu |
| Model: | PRIMERGY CX120 S1 (Intel Xeon L5530) |
| Form Factor: | 1U |
| CPU Name: | Intel Xeon L5530 |
| CPU Characteristics: | Quad-Core, 2.40GHz, 8MB L3 Cache |
| CPU Frequency (MHz): | 2400 |
| CPU(s) Enabled: | 8 cores, 2 chips, 4 cores/chip |
| Hardware Threads: | 16 (2 / core) |
| CPU(s) Orderable: | 1,2 chips |
| Primary Cache: | 32 KB I + 32 KB D on chip per core |
| Secondary Cache: | 256 KB I+D on chip per core |
| Tertiary Cache: | 8 MB I+D on chip per chip |
| Other Cache: | None |
| Memory Amount (GB): | 8 |
| # and size of DIMM: | 4 x 2048 MB |
| Memory Details: | 2GB 2Rx8 PC3-10600E ECC CL9; slots B1, C1, E1, F1 populated |
| Power Supply Quantity and Rating (W): | 1 x 400 |
| Power Supply Details: | Fujitsu Technology Solutions DPS-460GP A |
| Disk Drive: | 1 x 160GB HDD SATA (2.5", 5.4krpm) |
| Disk Controller: | Integrated SATA Controller |
| # and type of Network Interface Cards (NICs) Installed: | 2 x Intel 82576 Gigabit Network Connection (onboard) |
| NICs Enabled in Firmware / OS / Connected: | 2/1/1 |
| Network Speed (Mbit): | 1000 |
| Keyboard: | None |
| Mouse: | None |
| Monitor: | None |
| Optical Drives: | No |
| Other Hardware: | None |
| Software | |
|---|---|
| Power Management: | Enabled ("Fujitsu Enhanced Power Settings" power plan) |
| Operating System (OS): | Microsoft Windows Server 2008 R2 Enterprise |
| OS Version: | Version 6.1.7600 Build 7600 |
| Filesystem: | NTFS |
| JVM Vendor: | IBM Corporation |
| JVM Version: | IBM J9 VM (build 2.4, JRE 1.6.0 IBM J9 2.4 Windows Server 2008 amd64-64 jvmwa6460sr6-20090923_42924 (JIT enabled, AOT enabled) |
| JVM Command-line Options: | -Xaggressive -Xcompressedrefs -Xgcpolicy:gencon -Xmn1400m -Xms1550m -Xmx1550m -XlockReservation -Xnoloa -XtlhPrefetch -Xlp -Xgcthreads4 |
| JVM Affinity: | start /affinity [0x000F,0x00F0,0x0F00,0xF000] |
| JVM Instances: | 4 |
| JVM Initial Heap (MB): | 1550 |
| JVM Maximum Heap (MB): | 1550 |
| JVM Address Bits: | 64 |
| Boot Firmware Version: | 0.46 |
| Management Firmware Version: | 0.48 |
| Workload Version: | SSJ 1.2.6 |
| Director Location: | Controller |
| Other Software: | None |
| JVM Instance | ssj_ops@100% |
|---|---|
| Node-8.001 | 133,319 |
| Node-8.002 | 133,116 |
| Node-8.003 | 132,250 |
| Node-8.004 | 132,106 |
| ssj_ops@100% | 530,791 |
| ssj_ops@100% per JVM | 132,698 |

| Target Load | Actual Load | ssj_ops | |
|---|---|---|---|
| Target | Actual | ||
| Calibration 1 | 134,330 | ||
| Calibration 2 | 134,042 | ||
| Calibration 3 | 133,565 | ||
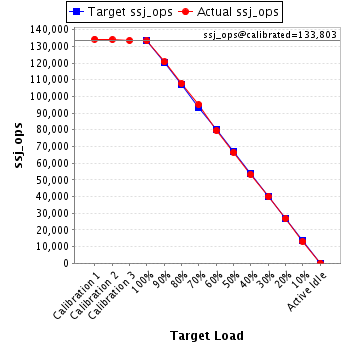
| ssj_ops@calibrated=133,803 | |||
| 100% | 99.6% | 133,803 | 133,319 |
| 90% | 90.2% | 120,423 | 120,649 |
| 80% | 80.5% | 107,043 | 107,776 |
| 70% | 71.0% | 93,662 | 95,054 |
| 60% | 59.4% | 80,282 | 79,536 |
| 50% | 49.7% | 66,902 | 66,443 |
| 40% | 39.7% | 53,521 | 53,126 |
| 30% | 29.9% | 40,141 | 39,944 |
| 20% | 20.0% | 26,761 | 26,766 |
| 10% | 9.7% | 13,380 | 13,037 |
| Active Idle | 0 | 0 | |
| Target Load | Actual Load | ssj_ops | |
|---|---|---|---|
| Target | Actual | ||
| Calibration 1 | 130,771 | ||
| Calibration 2 | 132,369 | ||
| Calibration 3 | 132,813 | ||
| ssj_ops@calibrated=132,591 | |||
| 100% | 100.4% | 132,591 | 133,116 |
| 90% | 89.9% | 119,332 | 119,187 |
| 80% | 80.3% | 106,073 | 106,527 |
| 70% | 70.2% | 92,814 | 93,015 |
| 60% | 60.0% | 79,555 | 79,592 |
| 50% | 50.7% | 66,295 | 67,239 |
| 40% | 39.8% | 53,036 | 52,835 |
| 30% | 30.2% | 39,777 | 40,104 |
| 20% | 19.8% | 26,518 | 26,261 |
| 10% | 9.8% | 13,259 | 12,975 |
| Active Idle | 0 | 0 | |

| Target Load | Actual Load | ssj_ops | |
|---|---|---|---|
| Target | Actual | ||
| Calibration 1 | 131,859 | ||
| Calibration 2 | 133,001 | ||
| Calibration 3 | 132,735 | ||
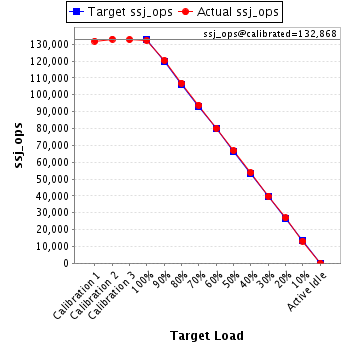
| ssj_ops@calibrated=132,868 | |||
| 100% | 99.5% | 132,868 | 132,250 |
| 90% | 90.6% | 119,581 | 120,395 |
| 80% | 80.5% | 106,294 | 106,953 |
| 70% | 70.6% | 93,008 | 93,854 |
| 60% | 60.3% | 79,721 | 80,155 |
| 50% | 50.3% | 66,434 | 66,850 |
| 40% | 40.5% | 53,147 | 53,792 |
| 30% | 30.0% | 39,860 | 39,841 |
| 20% | 20.2% | 26,574 | 26,869 |
| 10% | 9.9% | 13,287 | 13,201 |
| Active Idle | 0 | 0 | |
| Target Load | Actual Load | ssj_ops | |
|---|---|---|---|
| Target | Actual | ||
| Calibration 1 | 132,084 | ||
| Calibration 2 | 132,453 | ||
| Calibration 3 | 131,973 | ||
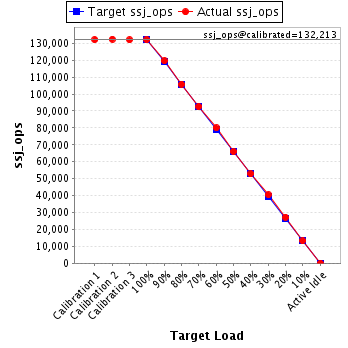
| ssj_ops@calibrated=132,213 | |||
| 100% | 99.9% | 132,213 | 132,106 |
| 90% | 90.5% | 118,992 | 119,625 |
| 80% | 80.1% | 105,771 | 105,859 |
| 70% | 70.0% | 92,549 | 92,588 |
| 60% | 60.5% | 79,328 | 80,054 |
| 50% | 50.0% | 66,107 | 66,076 |
| 40% | 39.9% | 52,885 | 52,779 |
| 30% | 30.6% | 39,664 | 40,502 |
| 20% | 20.6% | 26,443 | 27,267 |
| 10% | 10.0% | 13,221 | 13,220 |
| Active Idle | 0 | 0 | |