SPECpower_ssj2008
Host 'WIN-77M9M0Q7TKL' Performance Report
Copyright © 2007-2010 Standard Performance Evaluation Corporation
| IBM Corporation IBM System x iDataPlex dx360 M3 | ssj_ops@100% = 894,921 ssj_ops@100% per JVM = 149,153 |
||||
| Test Sponsor: | IBM Corporation | SPEC License #: | 11 | Test Method: | Multi Node |
| Tested By: | IBM Corporation | Test Location: | Nankang, Taipei, Taiwan | Test Date: | Mar 10, 2010 |
| Hardware Availability: | Jun-2010 | Software Availability: | Oct-2009 | Publication: | Apr 7, 2010 |
| System Source: | Single Supplier | System Designation: | Server | Power Provisioning: | Line-powered |
| Target Load | Actual Load | ssj_ops | |
|---|---|---|---|
| Target | Actual | ||
| Calibration 1 | 898,072 | ||
| Calibration 2 | 899,687 | ||
| Calibration 3 | 899,670 | ||
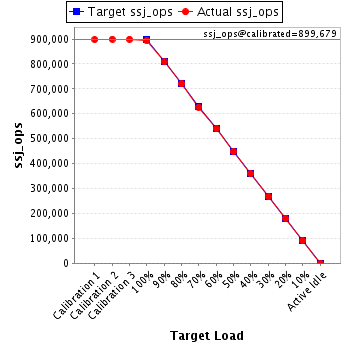
| ssj_ops@calibrated=899,679 | |||
| 100% | 99.5% | 899,679 | 894,921 |
| 90% | 89.8% | 809,711 | 808,051 |
| 80% | 80.1% | 719,743 | 720,266 |
| 70% | 69.7% | 629,775 | 627,115 |
| 60% | 60.1% | 539,807 | 540,658 |
| 50% | 50.0% | 449,839 | 449,520 |
| 40% | 40.0% | 359,871 | 360,118 |
| 30% | 30.0% | 269,904 | 269,517 |
| 20% | 20.0% | 179,936 | 179,998 |
| 10% | 10.1% | 89,968 | 90,684 |
| Active Idle | 0 | 0 | |
| Set Identifier: | sut |
| Set Description: | System Under Test |
| # of Identical Nodes: | 2 |
| Comment: | None |
| Hardware | |
|---|---|
| Hardware Vendor: | IBM Corporation |
| Model: | IBM System x iDataPlex dx360 M3 |
| Form Factor: | 2U |
| CPU Name: | Intel Xeon X5670 |
| CPU Characteristics: | Six-Core, 2.93GHz, 12MB L3 Cache |
| CPU Frequency (MHz): | 2933 |
| CPU(s) Enabled: | 12 cores, 2 chips, 6 cores/chip |
| Hardware Threads: | 24 (2 / core) |
| CPU(s) Orderable: | 1,2 chips |
| Primary Cache: | 32 KB I + 32 KB D on chip per core |
| Secondary Cache: | 256 KB I+D on chip per core |
| Tertiary Cache: | 12 MB I+D on chip per chip |
| Other Cache: | None |
| Memory Amount (GB): | 12 |
| # and size of DIMM: | 6 x 2048 MB |
| Memory Details: | 2GB 2Rx8 PC3L-10600R; slots 3, 6, 8, 11, 14, and 16 populated |
| Power Supply Quantity and Rating (W): | None |
| Power Supply Details: | Shared |
| Disk Drive: | 1 x 50 GB SATA SSD, feature code 5197 |
| Disk Controller: | Integrated SATA controller |
| # and type of Network Interface Cards (NICs) Installed: | 2 x Integrated Intel 82575 Gigabit Ethernet Controller |
| NICs Enabled in Firmware / OS / Connected: | 1/1/1 |
| Network Speed (Mbit): | 1000 |
| Keyboard: | KVM |
| Mouse: | KVM |
| Monitor: | KVM |
| Optical Drives: | No |
| Other Hardware: | None |
| Software | |
|---|---|
| Power Management: | Power saver plan in OS |
| Operating System (OS): | Microsoft Windows Server 2008 x64 Datacenter Edition |
| OS Version: | R2 |
| Filesystem: | NTFS |
| JVM Vendor: | IBM Corporation |
| JVM Version: | IBM J9 VM (build pwa6460sr5-20090529_04(SR5)) |
| JVM Command-line Options: | -Xaggressive -Xcompressedrefs -Xgcpolicy:gencon -Xmn1100m -Xms1500m -Xmx1500m -XlockReservation -Xnoloa -XtlhPrefetch -Xlp |
| JVM Affinity: | start /affinity [F,F0,F00,F000,F0000,F00000] |
| JVM Instances: | 6 |
| JVM Initial Heap (MB): | 1500 |
| JVM Maximum Heap (MB): | 1500 |
| JVM Address Bits: | 64 |
| Boot Firmware Version: | TME145U |
| Management Firmware Version: | YUOO57F |
| Workload Version: | SSJ 1.2.6 |
| Director Location: | Controller |
| Other Software: | None |
| JVM Instance | ssj_ops@100% |
|---|---|
| WIN-77M9M0Q7TKL.001 | 146,308 |
| WIN-77M9M0Q7TKL.002 | 146,073 |
| WIN-77M9M0Q7TKL.003 | 148,025 |
| WIN-77M9M0Q7TKL.004 | 150,118 |
| WIN-77M9M0Q7TKL.005 | 151,943 |
| WIN-77M9M0Q7TKL.006 | 152,453 |
| ssj_ops@100% | 894,921 |
| ssj_ops@100% per JVM | 149,153 |

| Target Load | Actual Load | ssj_ops | |
|---|---|---|---|
| Target | Actual | ||
| Calibration 1 | 146,625 | ||
| Calibration 2 | 146,836 | ||
| Calibration 3 | 147,104 | ||
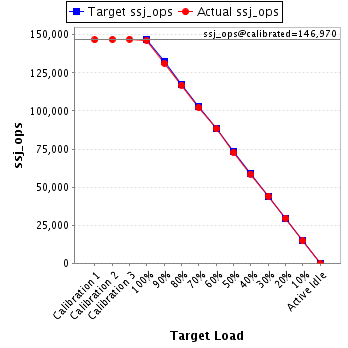
| ssj_ops@calibrated=146,970 | |||
| 100% | 99.5% | 146,970 | 146,308 |
| 90% | 89.4% | 132,273 | 131,348 |
| 80% | 79.6% | 117,576 | 117,013 |
| 70% | 69.5% | 102,879 | 102,214 |
| 60% | 60.1% | 88,182 | 88,297 |
| 50% | 49.5% | 73,485 | 72,730 |
| 40% | 39.8% | 58,788 | 58,561 |
| 30% | 30.0% | 44,091 | 44,063 |
| 20% | 20.2% | 29,394 | 29,643 |
| 10% | 10.0% | 14,697 | 14,707 |
| Active Idle | 0 | 0 | |
| Target Load | Actual Load | ssj_ops | |
|---|---|---|---|
| Target | Actual | ||
| Calibration 1 | 146,848 | ||
| Calibration 2 | 145,735 | ||
| Calibration 3 | 147,216 | ||
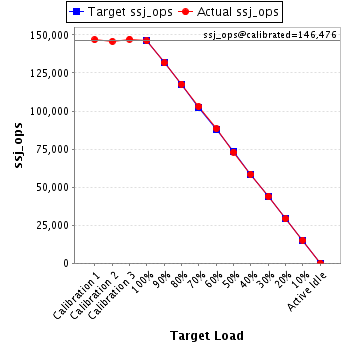
| ssj_ops@calibrated=146,476 | |||
| 100% | 99.7% | 146,476 | 146,073 |
| 90% | 89.9% | 131,828 | 131,645 |
| 80% | 80.4% | 117,181 | 117,717 |
| 70% | 70.3% | 102,533 | 102,947 |
| 60% | 60.4% | 87,885 | 88,471 |
| 50% | 49.9% | 73,238 | 73,052 |
| 40% | 39.9% | 58,590 | 58,426 |
| 30% | 30.0% | 43,943 | 43,978 |
| 20% | 19.9% | 29,295 | 29,132 |
| 10% | 10.4% | 14,648 | 15,216 |
| Active Idle | 0 | 0 | |
| Target Load | Actual Load | ssj_ops | |
|---|---|---|---|
| Target | Actual | ||
| Calibration 1 | 148,032 | ||
| Calibration 2 | 148,527 | ||
| Calibration 3 | 148,596 | ||
| ssj_ops@calibrated=148,561 | |||
| 100% | 99.6% | 148,561 | 148,025 |
| 90% | 90.4% | 133,705 | 134,344 |
| 80% | 80.5% | 118,849 | 119,565 |
| 70% | 70.4% | 103,993 | 104,596 |
| 60% | 59.3% | 89,137 | 88,134 |
| 50% | 50.4% | 74,281 | 74,829 |
| 40% | 39.5% | 59,425 | 58,708 |
| 30% | 29.9% | 44,568 | 44,388 |
| 20% | 19.8% | 29,712 | 29,482 |
| 10% | 9.6% | 14,856 | 14,200 |
| Active Idle | 0 | 0 | |

| Target Load | Actual Load | ssj_ops | |
|---|---|---|---|
| Target | Actual | ||
| Calibration 1 | 150,345 | ||
| Calibration 2 | 151,090 | ||
| Calibration 3 | 150,198 | ||
| ssj_ops@calibrated=150,644 | |||
| 100% | 99.7% | 150,644 | 150,118 |
| 90% | 90.0% | 135,580 | 135,527 |
| 80% | 79.7% | 120,515 | 120,040 |
| 70% | 68.9% | 105,451 | 103,836 |
| 60% | 60.8% | 90,386 | 91,558 |
| 50% | 50.1% | 75,322 | 75,499 |
| 40% | 40.3% | 60,258 | 60,731 |
| 30% | 30.2% | 45,193 | 45,440 |
| 20% | 19.9% | 30,129 | 29,965 |
| 10% | 10.2% | 15,064 | 15,400 |
| Active Idle | 0 | 0 | |

| Target Load | Actual Load | ssj_ops | |
|---|---|---|---|
| Target | Actual | ||
| Calibration 1 | 152,629 | ||
| Calibration 2 | 153,411 | ||
| Calibration 3 | 152,717 | ||
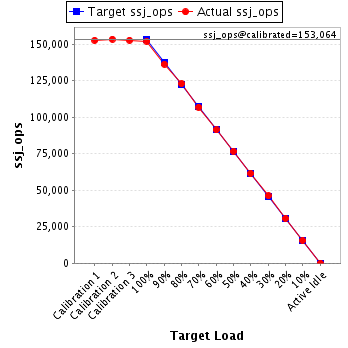
| ssj_ops@calibrated=153,064 | |||
| 100% | 99.3% | 153,064 | 151,943 |
| 90% | 89.1% | 137,757 | 136,331 |
| 80% | 80.3% | 122,451 | 122,856 |
| 70% | 69.9% | 107,145 | 106,930 |
| 60% | 59.7% | 91,838 | 91,334 |
| 50% | 50.1% | 76,532 | 76,751 |
| 40% | 40.2% | 61,226 | 61,493 |
| 30% | 30.1% | 45,919 | 46,116 |
| 20% | 20.1% | 30,613 | 30,752 |
| 10% | 10.2% | 15,306 | 15,641 |
| Active Idle | 0 | 0 | |
| Target Load | Actual Load | ssj_ops | |
|---|---|---|---|
| Target | Actual | ||
| Calibration 1 | 153,592 | ||
| Calibration 2 | 154,088 | ||
| Calibration 3 | 153,838 | ||
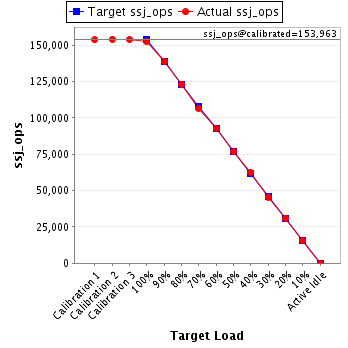
| ssj_ops@calibrated=153,963 | |||
| 100% | 99.0% | 153,963 | 152,453 |
| 90% | 90.2% | 138,567 | 138,857 |
| 80% | 79.9% | 123,171 | 123,076 |
| 70% | 69.2% | 107,774 | 106,591 |
| 60% | 60.3% | 92,378 | 92,865 |
| 50% | 49.8% | 76,982 | 76,658 |
| 40% | 40.4% | 61,585 | 62,198 |
| 30% | 29.6% | 46,189 | 45,532 |
| 20% | 20.2% | 30,793 | 31,025 |
| 10% | 10.1% | 15,396 | 15,521 |
| Active Idle | 0 | 0 | |