SPECpower_ssj2008
Host 'WIN-SSOJHFLOP15' Performance Report
Copyright © 2007-2010 Standard Performance Evaluation Corporation
| Dell Inc. PowerEdge R710 (Intel Xeon X5670, 2.93 GHz) | ssj_ops@100% = 910,681 ssj_ops@100% per JVM = 151,780 |
||||
| Test Sponsor: | Dell Inc. | SPEC License #: | 55 | Test Method: | Single Node |
| Tested By: | Dell Inc. | Test Location: | Round Rock, TX, USA | Test Date: | May 3, 2010 |
| Hardware Availability: | Jul-2010 | Software Availability: | Sep-2009 | Publication: | May 19, 2010 |
| System Source: | Single Supplier | System Designation: | Server | Power Provisioning: | Line-powered |
| Target Load | Actual Load | ssj_ops | |
|---|---|---|---|
| Target | Actual | ||
| Calibration 1 | 908,816 | ||
| Calibration 2 | 915,252 | ||
| Calibration 3 | 914,379 | ||
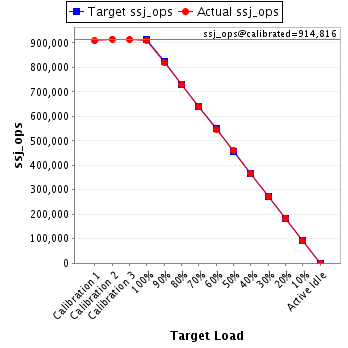
| ssj_ops@calibrated=914,816 | |||
| 100% | 99.5% | 914,816 | 910,681 |
| 90% | 89.8% | 823,334 | 821,276 |
| 80% | 79.9% | 731,853 | 730,542 |
| 70% | 70.1% | 640,371 | 641,166 |
| 60% | 59.8% | 548,889 | 546,855 |
| 50% | 50.3% | 457,408 | 460,251 |
| 40% | 40.0% | 365,926 | 365,731 |
| 30% | 29.9% | 274,445 | 273,925 |
| 20% | 20.0% | 182,963 | 182,962 |
| 10% | 10.0% | 91,482 | 91,601 |
| Active Idle | 0 | 0 | |
| Set Identifier: | sut |
| Set Description: | System Under Test |
| # of Identical Nodes: | 1 |
| Comment: | None |
| Hardware | |
|---|---|
| Hardware Vendor: | Dell Inc. |
| Model: | PowerEdge R710 (Intel Xeon X5670, 2.93 GHz) |
| Form Factor: | 2U |
| CPU Name: | Intel Xeon X5670 |
| CPU Characteristics: | Six Core, 2.93 GHz, 12 MB L3 Cache |
| CPU Frequency (MHz): | 2933 |
| CPU(s) Enabled: | 12 cores, 2 chips, 6 cores/chip |
| Hardware Threads: | 24 (2 / core) |
| CPU(s) Orderable: | 1,2 chip |
| Primary Cache: | 32 KB I + 32 KB D on chip per core |
| Secondary Cache: | 256 KB I+D on chip per core |
| Tertiary Cache: | 12 MB I+D on chip per chip |
| Other Cache: | None |
| Memory Amount (GB): | 12 |
| # and size of DIMM: | 6 x 2048 MB |
| Memory Details: | 2GB 2Rx8 PC3L-10600R (running at 1066MHz) ECC, Slots A1-A3, B1-B3 populated |
| Power Supply Quantity and Rating (W): | 1 x 570 |
| Power Supply Details: | Dell PN FU100 |
| Disk Drive: | 1 x 50 GB SSD SATA (Dell PN Y949P) |
| Disk Controller: | H200 Integrated |
| # and type of Network Interface Cards (NICs) Installed: | 2 x onboard dual-port gigabit |
| NICs Enabled in Firmware / OS / Connected: | 2/1/1 |
| Network Speed (Mbit): | 1000 |
| Keyboard: | None |
| Mouse: | None |
| Monitor: | None |
| Optical Drives: | No |
| Other Hardware: | None |
| Software | |
|---|---|
| Power Management: | Power Saver Mode Enabled in OS |
| Operating System (OS): | Windows 2008 Server Enterprise x64 Edition |
| OS Version: | R2 |
| Filesystem: | NTFS |
| JVM Vendor: | IBM Corporation |
| JVM Version: | IBM J9 VM (build 2.4, J2RE 1.6.0 IBM J9 2.4 Windows Server 2008 amd64-64 jvmwa64 60sr5-20090519_35743 (JIT enabled, AOT enabled) |
| JVM Command-line Options: | -Xmn1100m -Xms1500m -Xmx1500m -Xaggressive -Xcompressedrefs -Xgcpolicy:gencon -XlockReservation -Xnoloa -XtlhPrefetch -Xlp |
| JVM Affinity: | start /affinity [F,F0,F00,F000,F0000,F00000] |
| JVM Instances: | 6 |
| JVM Initial Heap (MB): | 1500 |
| JVM Maximum Heap (MB): | 1500 |
| JVM Address Bits: | 64 |
| Boot Firmware Version: | 2.1.6 |
| Management Firmware Version: | X09 1.5.0 |
| Workload Version: | SSJ 1.2.6 |
| Director Location: | Controller |
| Other Software: | None |
| JVM Instance | ssj_ops@100% |
|---|---|
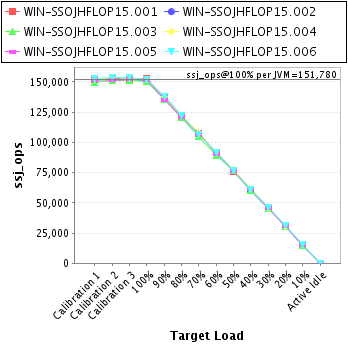
| WIN-SSOJHFLOP15.001 | 152,611 |
| WIN-SSOJHFLOP15.002 | 151,476 |
| WIN-SSOJHFLOP15.003 | 149,998 |
| WIN-SSOJHFLOP15.004 | 152,405 |
| WIN-SSOJHFLOP15.005 | 151,793 |
| WIN-SSOJHFLOP15.006 | 152,399 |
| ssj_ops@100% | 910,681 |
| ssj_ops@100% per JVM | 151,780 |
| Target Load | Actual Load | ssj_ops | |
|---|---|---|---|
| Target | Actual | ||
| Calibration 1 | 151,654 | ||
| Calibration 2 | 152,561 | ||
| Calibration 3 | 152,029 | ||
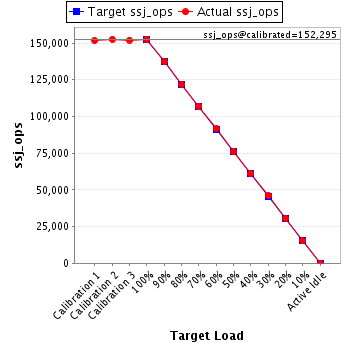
| ssj_ops@calibrated=152,295 | |||
| 100% | 100.2% | 152,295 | 152,611 |
| 90% | 90.1% | 137,066 | 137,278 |
| 80% | 79.9% | 121,836 | 121,716 |
| 70% | 70.2% | 106,607 | 106,964 |
| 60% | 60.1% | 91,377 | 91,595 |
| 50% | 50.0% | 76,148 | 76,141 |
| 40% | 40.3% | 60,918 | 61,352 |
| 30% | 30.3% | 45,689 | 46,154 |
| 20% | 19.9% | 30,459 | 30,273 |
| 10% | 10.1% | 15,230 | 15,362 |
| Active Idle | 0 | 0 | |
| Target Load | Actual Load | ssj_ops | |
|---|---|---|---|
| Target | Actual | ||
| Calibration 1 | 151,237 | ||
| Calibration 2 | 152,586 | ||
| Calibration 3 | 152,333 | ||
| ssj_ops@calibrated=152,459 | |||
| 100% | 99.4% | 152,459 | 151,476 |
| 90% | 90.3% | 137,213 | 137,674 |
| 80% | 80.0% | 121,967 | 121,976 |
| 70% | 70.2% | 106,722 | 107,071 |
| 60% | 60.0% | 91,476 | 91,409 |
| 50% | 50.2% | 76,230 | 76,466 |
| 40% | 39.5% | 60,984 | 60,157 |
| 30% | 29.9% | 45,738 | 45,589 |
| 20% | 20.1% | 30,492 | 30,656 |
| 10% | 10.0% | 15,246 | 15,182 |
| Active Idle | 0 | 0 | |

| Target Load | Actual Load | ssj_ops | |
|---|---|---|---|
| Target | Actual | ||
| Calibration 1 | 149,340 | ||
| Calibration 2 | 151,004 | ||
| Calibration 3 | 151,216 | ||
| ssj_ops@calibrated=151,110 | |||
| 100% | 99.3% | 151,110 | 149,998 |
| 90% | 89.4% | 135,999 | 135,142 |
| 80% | 80.0% | 120,888 | 120,907 |
| 70% | 69.6% | 105,777 | 105,116 |
| 60% | 59.2% | 90,666 | 89,450 |
| 50% | 50.7% | 75,555 | 76,620 |
| 40% | 39.9% | 60,444 | 60,331 |
| 30% | 30.1% | 45,333 | 45,521 |
| 20% | 20.1% | 30,222 | 30,310 |
| 10% | 9.9% | 15,111 | 14,917 |
| Active Idle | 0 | 0 | |

| Target Load | Actual Load | ssj_ops | |
|---|---|---|---|
| Target | Actual | ||
| Calibration 1 | 152,045 | ||
| Calibration 2 | 153,962 | ||
| Calibration 3 | 153,010 | ||
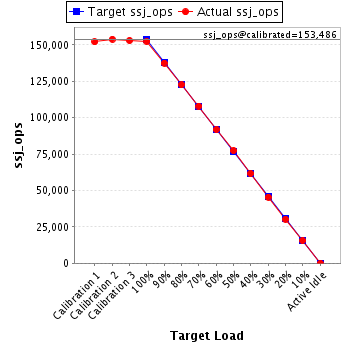
| ssj_ops@calibrated=153,486 | |||
| 100% | 99.3% | 153,486 | 152,405 |
| 90% | 89.6% | 138,137 | 137,573 |
| 80% | 79.8% | 122,789 | 122,531 |
| 70% | 70.4% | 107,440 | 108,024 |
| 60% | 59.9% | 92,092 | 91,894 |
| 50% | 50.4% | 76,743 | 77,374 |
| 40% | 40.2% | 61,394 | 61,678 |
| 30% | 29.6% | 46,046 | 45,491 |
| 20% | 19.7% | 30,697 | 30,299 |
| 10% | 10.2% | 15,349 | 15,666 |
| Active Idle | 0 | 0 | |
| Target Load | Actual Load | ssj_ops | |
|---|---|---|---|
| Target | Actual | ||
| Calibration 1 | 151,747 | ||
| Calibration 2 | 151,621 | ||
| Calibration 3 | 152,349 | ||
| ssj_ops@calibrated=151,985 | |||
| 100% | 99.9% | 151,985 | 151,793 |
| 90% | 89.0% | 136,787 | 135,323 |
| 80% | 79.5% | 121,588 | 120,834 |
| 70% | 70.5% | 106,390 | 107,086 |
| 60% | 59.6% | 91,191 | 90,563 |
| 50% | 50.3% | 75,993 | 76,520 |
| 40% | 40.2% | 60,794 | 61,104 |
| 30% | 29.8% | 45,596 | 45,319 |
| 20% | 20.1% | 30,397 | 30,564 |
| 10% | 9.9% | 15,199 | 15,095 |
| Active Idle | 0 | 0 | |

| Target Load | Actual Load | ssj_ops | |
|---|---|---|---|
| Target | Actual | ||
| Calibration 1 | 152,794 | ||
| Calibration 2 | 153,517 | ||
| Calibration 3 | 153,442 | ||
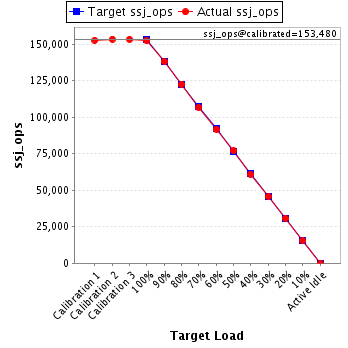
| ssj_ops@calibrated=153,480 | |||
| 100% | 99.3% | 153,480 | 152,399 |
| 90% | 90.1% | 138,132 | 138,286 |
| 80% | 79.9% | 122,784 | 122,578 |
| 70% | 69.7% | 107,436 | 106,904 |
| 60% | 59.9% | 92,088 | 91,944 |
| 50% | 50.3% | 76,740 | 77,131 |
| 40% | 39.8% | 61,392 | 61,108 |
| 30% | 29.9% | 46,044 | 45,852 |
| 20% | 20.1% | 30,696 | 30,859 |
| 10% | 10.0% | 15,348 | 15,380 |
| Active Idle | 0 | 0 | |