SPECpower_ssj2008
Host 'WIN-P6TVTI9CSQM' Performance Report
Copyright © 2007-2010 Standard Performance Evaluation Corporation
| ZT Systems 1253Ra Datacenter Server | ssj_ops@100% = 409,496 ssj_ops@100% per JVM = 204,748 |
||||
| Test Sponsor: | ZT Systems | SPEC License #: | 49 | Test Method: | Single Node |
| Tested By: | Advanced Micro Devices | Test Location: | Austin, TX, USA | Test Date: | May 28, 2010 |
| Hardware Availability: | Aug-2010 | Software Availability: | Aug-2009 | Publication: | Jun 23, 2010 |
| System Source: | Single Supplier | System Designation: | Server | Power Provisioning: | Line-powered |
| Target Load | Actual Load | ssj_ops | |
|---|---|---|---|
| Target | Actual | ||
| Calibration 1 | 412,075 | ||
| Calibration 2 | 412,568 | ||
| Calibration 3 | 412,855 | ||
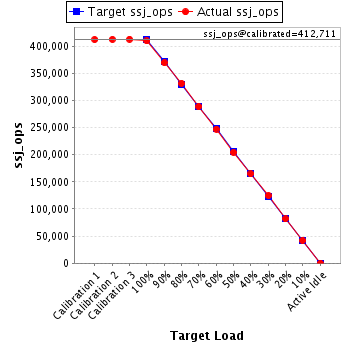
| ssj_ops@calibrated=412,711 | |||
| 100% | 99.2% | 412,711 | 409,496 |
| 90% | 89.5% | 371,440 | 369,474 |
| 80% | 80.3% | 330,169 | 331,547 |
| 70% | 69.9% | 288,898 | 288,590 |
| 60% | 59.9% | 247,627 | 247,266 |
| 50% | 49.6% | 206,356 | 204,530 |
| 40% | 39.8% | 165,084 | 164,461 |
| 30% | 30.2% | 123,813 | 124,587 |
| 20% | 19.8% | 82,542 | 81,583 |
| 10% | 10.2% | 41,271 | 42,209 |
| Active Idle | 0 | 0 | |
| Set Identifier: | sut |
| Set Description: | ZT Systems 1253Ra Datacenter Server |
| # of Identical Nodes: | 1 |
| Comment: | None |
| Hardware | |
|---|---|
| Hardware Vendor: | ZT Systems |
| Model: | 1253Ra Datacenter Server |
| Form Factor: | 1U |
| CPU Name: | AMD Opteron 4164 EE |
| CPU Characteristics: | Six-Core, 1.8GHz, 6MB L3 Cache |
| CPU Frequency (MHz): | 1800 |
| CPU(s) Enabled: | 12 cores, 2 chips, 6 cores/chip |
| Hardware Threads: | 12 (1 / core) |
| CPU(s) Orderable: | 1,2 chips |
| Primary Cache: | 64 KB I + 64 KB D on chip per core |
| Secondary Cache: | 512 KB I+D on chip per core |
| Tertiary Cache: | 6 MB I+D on chip per chip |
| Other Cache: | None |
| Memory Amount (GB): | 16 |
| # and size of DIMM: | 4 x 4096 MB |
| Memory Details: | 4GB 2Rx4 PC3L-10600R-09-10-E1-D2; Slots A1, B1 populated for each socket |
| Power Supply Quantity and Rating (W): | 1 x 250 |
| Power Supply Details: | Emacs V1E-5250V |
| Disk Drive: | 1 x 128GB Western Digital SSD; SSC-D0128SC-2100 |
| Disk Controller: | Integrated SATA controller |
| # and type of Network Interface Cards (NICs) Installed: | 2 x Integrated Intel 82576 Gigabit Dual Port |
| NICs Enabled in Firmware / OS / Connected: | 1/1/1 |
| Network Speed (Mbit): | 1000 |
| Keyboard: | None |
| Mouse: | None |
| Monitor: | Direct |
| Optical Drives: | No |
| Other Hardware: | None |
| Software | |
|---|---|
| Power Management: | Enabled (Balanced power plan) (see SUT notes) |
| Operating System (OS): | Microsoft Windows Server 2008 R2 Enterprise |
| OS Version: | 64-bit |
| Filesystem: | NTFS |
| JVM Vendor: | IBM Corporation |
| JVM Version: | IBM J9 VM (build 2.4, J2RE 1.6.0 IBM J9 2.4 Windows Server 2008 amd64-64 jvmwa6460sr5ifx-20090612_37149 (JIT enabled, AOT enabled) |
| JVM Command-line Options: | -Xms1875m -Xmn1400m -Xmx1875m -Xcompressedrefs -Xaggressive -Xgcpolicy:gencon -Xlp -XlockReservation -Xnoloa -XtlhPrefetch |
| JVM Affinity: | start /affinity [3F, FC0] |
| JVM Instances: | 2 |
| JVM Initial Heap (MB): | 1875 |
| JVM Maximum Heap (MB): | 1875 |
| JVM Address Bits: | 64 |
| Boot Firmware Version: | 0.15 |
| Management Firmware Version: | v0.04 |
| Workload Version: | SSJ 1.2.6 |
| Director Location: | SUT |
| Other Software: | None |
| JVM Instance | ssj_ops@100% |
|---|---|
| WIN-P6TVTI9CSQM.001 | 207,542 |
| WIN-P6TVTI9CSQM.002 | 201,954 |
| ssj_ops@100% | 409,496 |
| ssj_ops@100% per JVM | 204,748 |

| Target Load | Actual Load | ssj_ops | |
|---|---|---|---|
| Target | Actual | ||
| Calibration 1 | 209,098 | ||
| Calibration 2 | 209,054 | ||
| Calibration 3 | 209,100 | ||
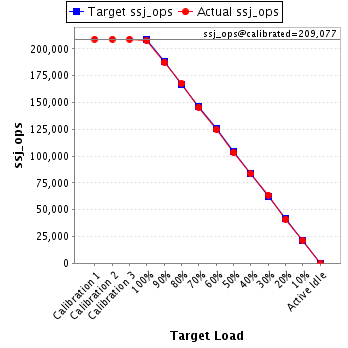
| ssj_ops@calibrated=209,077 | |||
| 100% | 99.3% | 209,077 | 207,542 |
| 90% | 89.7% | 188,169 | 187,605 |
| 80% | 80.3% | 167,262 | 167,854 |
| 70% | 69.7% | 146,354 | 145,667 |
| 60% | 59.7% | 125,446 | 124,824 |
| 50% | 49.4% | 104,538 | 103,313 |
| 40% | 40.0% | 83,631 | 83,531 |
| 30% | 30.4% | 62,723 | 63,587 |
| 20% | 19.7% | 41,815 | 41,214 |
| 10% | 10.2% | 20,908 | 21,248 |
| Active Idle | 0 | 0 | |
| Target Load | Actual Load | ssj_ops | |
|---|---|---|---|
| Target | Actual | ||
| Calibration 1 | 202,977 | ||
| Calibration 2 | 203,514 | ||
| Calibration 3 | 203,754 | ||
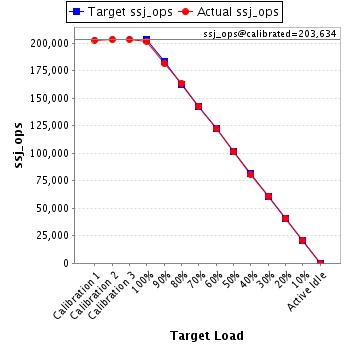
| ssj_ops@calibrated=203,634 | |||
| 100% | 99.2% | 203,634 | 201,954 |
| 90% | 89.3% | 183,271 | 181,868 |
| 80% | 80.4% | 162,907 | 163,694 |
| 70% | 70.2% | 142,544 | 142,923 |
| 60% | 60.1% | 122,181 | 122,442 |
| 50% | 49.7% | 101,817 | 101,217 |
| 40% | 39.7% | 81,454 | 80,930 |
| 30% | 30.0% | 61,090 | 61,000 |
| 20% | 19.8% | 40,727 | 40,370 |
| 10% | 10.3% | 20,363 | 20,961 |
| Active Idle | 0 | 0 | |