SPECpower_ssj2008
Host 'M610-1' Performance Report
Copyright © 2007-2010 Standard Performance Evaluation Corporation
| Dell Inc. PowerEdge M610 | ssj_ops@100% = 897,621 ssj_ops@100% per JVM = 149,603 |
||||
| Test Sponsor: | Dell Inc. | SPEC License #: | 55 | Test Method: | Multi Node |
| Tested By: | Dell Inc. | Test Location: | Round Rock, TX, USA | Test Date: | Aug 12, 2010 |
| Hardware Availability: | Sep-2010 | Software Availability: | Jul-2009 | Publication: | Sep 9, 2010 |
| System Source: | Single Supplier | System Designation: | Server | Power Provisioning: | Line-powered |
| Target Load | Actual Load | ssj_ops | |
|---|---|---|---|
| Target | Actual | ||
| Calibration 1 | 900,589 | ||
| Calibration 2 | 903,503 | ||
| Calibration 3 | 899,529 | ||
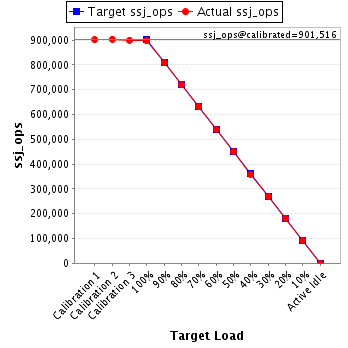
| ssj_ops@calibrated=901,516 | |||
| 100% | 99.6% | 901,516 | 897,621 |
| 90% | 89.8% | 811,364 | 809,795 |
| 80% | 79.7% | 721,213 | 718,852 |
| 70% | 70.1% | 631,061 | 631,934 |
| 60% | 60.0% | 540,909 | 541,023 |
| 50% | 50.0% | 450,758 | 450,317 |
| 40% | 39.9% | 360,606 | 359,380 |
| 30% | 30.0% | 270,455 | 270,442 |
| 20% | 20.0% | 180,303 | 180,076 |
| 10% | 10.1% | 90,152 | 90,965 |
| Active Idle | 0 | 0 | |
| Set Identifier: | sut |
| Set Description: | PowerEdge M610 |
| # of Identical Nodes: | 16 |
| Comment: | None |
| Hardware | |
|---|---|
| Hardware Vendor: | Dell Inc. |
| Model: | PowerEdge M610 |
| Form Factor: | Blade |
| CPU Name: | Intel Xeon X5670 |
| CPU Characteristics: | Six Core, 2.93 GHz, 12 MB L3 Cache |
| CPU Frequency (MHz): | 2933 |
| CPU(s) Enabled: | 12 cores, 2 chips, 6 cores/chip |
| Hardware Threads: | 24 (2 / core) |
| CPU(s) Orderable: | 1,2 chip |
| Primary Cache: | 32 KB I + 32 KB D on chip per core |
| Secondary Cache: | 256 KB I+D on chip per core |
| Tertiary Cache: | 12 MB I+D on chip per chip |
| Other Cache: | None |
| Memory Amount (GB): | 12 |
| # and size of DIMM: | 6 x 2048 MB |
| Memory Details: | 2GB 2Rx8 PC3L-10600E ECC, Slots A1-A3, B1-B3 populated |
| Power Supply Quantity and Rating (W): | None |
| Power Supply Details: | Shared |
| Disk Drive: | 1 x 50GB 2.5" SSD SATA (Dell PN Y949P) |
| Disk Controller: | Modular SATA Pass-Through |
| # and type of Network Interface Cards (NICs) Installed: | 1 x onboard dual-port Gigabit Ethernet |
| NICs Enabled in Firmware / OS / Connected: | 2/1/1 |
| Network Speed (Mbit): | 1000 |
| Keyboard: | None |
| Mouse: | None |
| Monitor: | None |
| Optical Drives: | No |
| Other Hardware: | None |
| Software | |
|---|---|
| Power Management: | Power Saver Mode in OS (See Notes) |
| Operating System (OS): | Windows 2008 Server Enterprise x64 Edition |
| OS Version: | R2 |
| Filesystem: | NTFS |
| JVM Vendor: | IBM Corporation |
| JVM Version: | IBM J9 VM (build 2.4, J2RE 1.6.0 IBM J9 2.4 Windows Server 2008 amd64-64 jvmwa64 60sr5-20090519_35743 (JIT enabled, AOT enabled) |
| JVM Command-line Options: | -Xmn1100m -Xms1500m -Xmx1500m -Xaggressive -Xcompressedrefs -Xgcpolicy:gencon -XlockReservation -Xnoloa -XtlhPrefetch -Xlp |
| JVM Affinity: | start /affinity [F,F0,F00,F000,F0000,F00000] |
| JVM Instances: | 6 |
| JVM Initial Heap (MB): | 1500 |
| JVM Maximum Heap (MB): | 1500 |
| JVM Address Bits: | 64 |
| Boot Firmware Version: | 2.1.9 |
| Management Firmware Version: | iDRAC 3.0.0 A02 / CMC 3.0.1 A00 |
| Workload Version: | SSJ 1.2.6 |
| Director Location: | Controller |
| Other Software: | None |
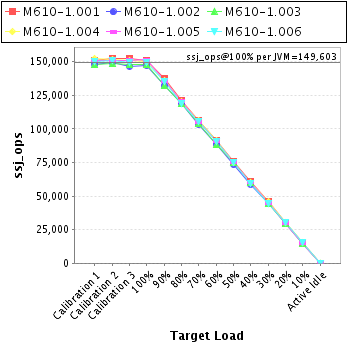
| JVM Instance | ssj_ops@100% |
|---|---|
| M610-1.001 | 151,236 |
| M610-1.002 | 147,273 |
| M610-1.003 | 148,060 |
| M610-1.004 | 149,996 |
| M610-1.005 | 151,339 |
| M610-1.006 | 149,716 |
| ssj_ops@100% | 897,621 |
| ssj_ops@100% per JVM | 149,603 |
| Target Load | Actual Load | ssj_ops | |
|---|---|---|---|
| Target | Actual | ||
| Calibration 1 | 151,172 | ||
| Calibration 2 | 152,661 | ||
| Calibration 3 | 152,250 | ||
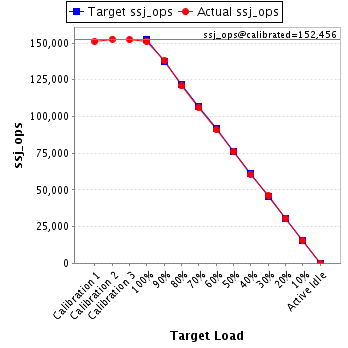
| ssj_ops@calibrated=152,456 | |||
| 100% | 99.2% | 152,456 | 151,236 |
| 90% | 90.4% | 137,210 | 137,867 |
| 80% | 79.2% | 121,965 | 120,787 |
| 70% | 69.8% | 106,719 | 106,450 |
| 60% | 59.7% | 91,473 | 91,039 |
| 50% | 49.8% | 76,228 | 75,994 |
| 40% | 39.9% | 60,982 | 60,791 |
| 30% | 30.1% | 45,737 | 45,894 |
| 20% | 19.9% | 30,491 | 30,369 |
| 10% | 10.2% | 15,246 | 15,588 |
| Active Idle | 0 | 0 | |
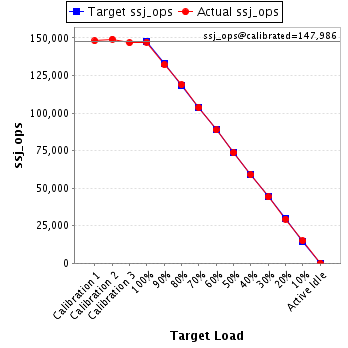
| Target Load | Actual Load | ssj_ops | |
|---|---|---|---|
| Target | Actual | ||
| Calibration 1 | 148,093 | ||
| Calibration 2 | 149,221 | ||
| Calibration 3 | 146,750 | ||
| ssj_ops@calibrated=147,986 | |||
| 100% | 99.5% | 147,986 | 147,273 |
| 90% | 89.3% | 133,187 | 132,156 |
| 80% | 80.3% | 118,389 | 118,844 |
| 70% | 70.0% | 103,590 | 103,616 |
| 60% | 60.0% | 88,791 | 88,750 |
| 50% | 49.7% | 73,993 | 73,565 |
| 40% | 39.8% | 59,194 | 58,826 |
| 30% | 29.8% | 44,396 | 44,130 |
| 20% | 19.9% | 29,597 | 29,467 |
| 10% | 10.1% | 14,799 | 14,878 |
| Active Idle | 0 | 0 | |
| Target Load | Actual Load | ssj_ops | |
|---|---|---|---|
| Target | Actual | ||
| Calibration 1 | 147,861 | ||
| Calibration 2 | 148,493 | ||
| Calibration 3 | 148,321 | ||
| ssj_ops@calibrated=148,407 | |||
| 100% | 99.8% | 148,407 | 148,060 |
| 90% | 89.3% | 133,566 | 132,516 |
| 80% | 80.3% | 118,725 | 119,152 |
| 70% | 70.2% | 103,885 | 104,173 |
| 60% | 59.5% | 89,044 | 88,292 |
| 50% | 50.5% | 74,203 | 74,981 |
| 40% | 40.3% | 59,363 | 59,764 |
| 30% | 30.1% | 44,522 | 44,678 |
| 20% | 20.0% | 29,681 | 29,615 |
| 10% | 10.1% | 14,841 | 14,985 |
| Active Idle | 0 | 0 | |

| Target Load | Actual Load | ssj_ops | |
|---|---|---|---|
| Target | Actual | ||
| Calibration 1 | 152,280 | ||
| Calibration 2 | 151,407 | ||
| Calibration 3 | 151,238 | ||
| ssj_ops@calibrated=151,322 | |||
| 100% | 99.1% | 151,322 | 149,996 |
| 90% | 89.7% | 136,190 | 135,742 |
| 80% | 79.5% | 121,058 | 120,298 |
| 70% | 70.3% | 105,926 | 106,364 |
| 60% | 60.3% | 90,793 | 91,228 |
| 50% | 49.7% | 75,661 | 75,212 |
| 40% | 39.9% | 60,529 | 60,324 |
| 30% | 30.2% | 45,397 | 45,694 |
| 20% | 20.3% | 30,264 | 30,701 |
| 10% | 10.2% | 15,132 | 15,491 |
| Active Idle | 0 | 0 | |

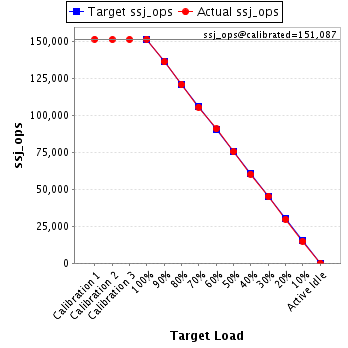
| Target Load | Actual Load | ssj_ops | |
|---|---|---|---|
| Target | Actual | ||
| Calibration 1 | 151,285 | ||
| Calibration 2 | 151,019 | ||
| Calibration 3 | 151,156 | ||
| ssj_ops@calibrated=151,087 | |||
| 100% | 100.2% | 151,087 | 151,339 |
| 90% | 90.0% | 135,979 | 136,025 |
| 80% | 79.9% | 120,870 | 120,670 |
| 70% | 69.8% | 105,761 | 105,445 |
| 60% | 60.1% | 90,652 | 90,797 |
| 50% | 49.8% | 75,544 | 75,292 |
| 40% | 39.8% | 60,435 | 60,146 |
| 30% | 29.9% | 45,326 | 45,208 |
| 20% | 19.6% | 30,217 | 29,663 |
| 10% | 9.9% | 15,109 | 14,899 |
| Active Idle | 0 | 0 | |
| Target Load | Actual Load | ssj_ops | |
|---|---|---|---|
| Target | Actual | ||
| Calibration 1 | 149,898 | ||
| Calibration 2 | 150,702 | ||
| Calibration 3 | 149,814 | ||
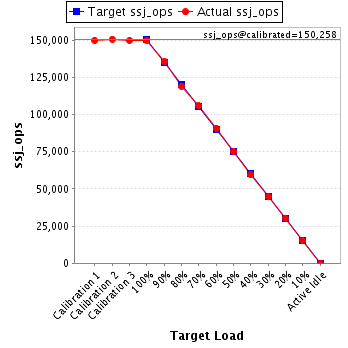
| ssj_ops@calibrated=150,258 | |||
| 100% | 99.6% | 150,258 | 149,716 |
| 90% | 90.2% | 135,232 | 135,489 |
| 80% | 79.3% | 120,206 | 119,101 |
| 70% | 70.5% | 105,181 | 105,885 |
| 60% | 60.5% | 90,155 | 90,916 |
| 50% | 50.1% | 75,129 | 75,273 |
| 40% | 39.6% | 60,103 | 59,529 |
| 30% | 29.8% | 45,077 | 44,838 |
| 20% | 20.1% | 30,052 | 30,261 |
| 10% | 10.1% | 15,026 | 15,124 |
| Active Idle | 0 | 0 | |