
SPECpower_ssj2008
Host 'M610-10' Performance Report
Copyright © 2007-2010 Standard Performance Evaluation Corporation
| Dell Inc. PowerEdge M610 | ssj_ops@100% = 907,718 ssj_ops@100% per JVM = 151,286 |
||||
| Test Sponsor: | Dell Inc. | SPEC License #: | 55 | Test Method: | Multi Node |
| Tested By: | Dell Inc. | Test Location: | Round Rock, TX, USA | Test Date: | Aug 12, 2010 |
| Hardware Availability: | Sep-2010 | Software Availability: | Jul-2009 | Publication: | Sep 9, 2010 |
| System Source: | Single Supplier | System Designation: | Server | Power Provisioning: | Line-powered |
| Target Load | Actual Load | ssj_ops | |
|---|---|---|---|
| Target | Actual | ||
| Calibration 1 | 910,512 | ||
| Calibration 2 | 911,596 | ||
| Calibration 3 | 912,202 | ||
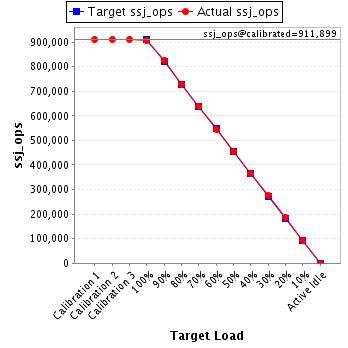
| ssj_ops@calibrated=911,899 | |||
| 100% | 99.5% | 911,899 | 907,718 |
| 90% | 90.3% | 820,709 | 823,725 |
| 80% | 79.9% | 729,519 | 728,412 |
| 70% | 70.1% | 638,329 | 639,442 |
| 60% | 59.9% | 547,139 | 546,324 |
| 50% | 49.9% | 455,949 | 455,050 |
| 40% | 40.0% | 364,760 | 364,623 |
| 30% | 30.2% | 273,570 | 275,409 |
| 20% | 20.2% | 182,380 | 184,287 |
| 10% | 10.0% | 91,190 | 91,200 |
| Active Idle | 0 | 0 | |
| Set Identifier: | sut |
| Set Description: | PowerEdge M610 |
| # of Identical Nodes: | 16 |
| Comment: | None |
| Hardware | |
|---|---|
| Hardware Vendor: | Dell Inc. |
| Model: | PowerEdge M610 |
| Form Factor: | Blade |
| CPU Name: | Intel Xeon X5670 |
| CPU Characteristics: | Six Core, 2.93 GHz, 12 MB L3 Cache |
| CPU Frequency (MHz): | 2933 |
| CPU(s) Enabled: | 12 cores, 2 chips, 6 cores/chip |
| Hardware Threads: | 24 (2 / core) |
| CPU(s) Orderable: | 1,2 chip |
| Primary Cache: | 32 KB I + 32 KB D on chip per core |
| Secondary Cache: | 256 KB I+D on chip per core |
| Tertiary Cache: | 12 MB I+D on chip per chip |
| Other Cache: | None |
| Memory Amount (GB): | 12 |
| # and size of DIMM: | 6 x 2048 MB |
| Memory Details: | 2GB 2Rx8 PC3L-10600E ECC, Slots A1-A3, B1-B3 populated |
| Power Supply Quantity and Rating (W): | None |
| Power Supply Details: | Shared |
| Disk Drive: | 1 x 50GB 2.5" SSD SATA (Dell PN Y949P) |
| Disk Controller: | Modular SATA Pass-Through |
| # and type of Network Interface Cards (NICs) Installed: | 1 x onboard dual-port Gigabit Ethernet |
| NICs Enabled in Firmware / OS / Connected: | 2/1/1 |
| Network Speed (Mbit): | 1000 |
| Keyboard: | None |
| Mouse: | None |
| Monitor: | None |
| Optical Drives: | No |
| Other Hardware: | None |
| Software | |
|---|---|
| Power Management: | Power Saver Mode in OS (See Notes) |
| Operating System (OS): | Windows 2008 Server Enterprise x64 Edition |
| OS Version: | R2 |
| Filesystem: | NTFS |
| JVM Vendor: | IBM Corporation |
| JVM Version: | IBM J9 VM (build 2.4, J2RE 1.6.0 IBM J9 2.4 Windows Server 2008 amd64-64 jvmwa64 60sr5-20090519_35743 (JIT enabled, AOT enabled) |
| JVM Command-line Options: | -Xmn1100m -Xms1500m -Xmx1500m -Xaggressive -Xcompressedrefs -Xgcpolicy:gencon -XlockReservation -Xnoloa -XtlhPrefetch -Xlp |
| JVM Affinity: | start /affinity [F,F0,F00,F000,F0000,F00000] |
| JVM Instances: | 6 |
| JVM Initial Heap (MB): | 1500 |
| JVM Maximum Heap (MB): | 1500 |
| JVM Address Bits: | 64 |
| Boot Firmware Version: | 2.1.9 |
| Management Firmware Version: | iDRAC 3.0.0 A02 / CMC 3.0.1 A00 |
| Workload Version: | SSJ 1.2.6 |
| Director Location: | Controller |
| Other Software: | None |
| JVM Instance | ssj_ops@100% |
|---|---|
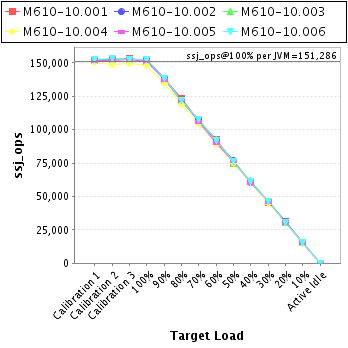
| M610-10.001 | 152,024 |
| M610-10.002 | 152,371 |
| M610-10.003 | 151,164 |
| M610-10.004 | 148,288 |
| M610-10.005 | 151,337 |
| M610-10.006 | 152,535 |
| ssj_ops@100% | 907,718 |
| ssj_ops@100% per JVM | 151,286 |
| Target Load | Actual Load | ssj_ops | |
|---|---|---|---|
| Target | Actual | ||
| Calibration 1 | 152,856 | ||
| Calibration 2 | 152,151 | ||
| Calibration 3 | 153,464 | ||
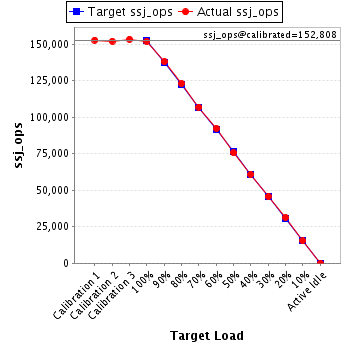
| ssj_ops@calibrated=152,808 | |||
| 100% | 99.5% | 152,808 | 152,024 |
| 90% | 90.3% | 137,527 | 137,981 |
| 80% | 80.5% | 122,246 | 123,010 |
| 70% | 70.0% | 106,965 | 106,994 |
| 60% | 60.5% | 91,685 | 92,380 |
| 50% | 49.5% | 76,404 | 75,678 |
| 40% | 39.9% | 61,123 | 60,988 |
| 30% | 30.0% | 45,842 | 45,777 |
| 20% | 20.5% | 30,562 | 31,281 |
| 10% | 10.0% | 15,281 | 15,341 |
| Active Idle | 0 | 0 | |
| Target Load | Actual Load | ssj_ops | |
|---|---|---|---|
| Target | Actual | ||
| Calibration 1 | 151,711 | ||
| Calibration 2 | 152,667 | ||
| Calibration 3 | 152,544 | ||
| ssj_ops@calibrated=152,605 | |||
| 100% | 99.8% | 152,605 | 152,371 |
| 90% | 90.4% | 137,345 | 138,021 |
| 80% | 79.1% | 122,084 | 120,774 |
| 70% | 70.5% | 106,824 | 107,537 |
| 60% | 59.7% | 91,563 | 91,071 |
| 50% | 50.3% | 76,303 | 76,725 |
| 40% | 39.6% | 61,042 | 60,356 |
| 30% | 30.4% | 45,782 | 46,353 |
| 20% | 20.5% | 30,521 | 31,322 |
| 10% | 10.0% | 15,261 | 15,200 |
| Active Idle | 0 | 0 | |

| Target Load | Actual Load | ssj_ops | |
|---|---|---|---|
| Target | Actual | ||
| Calibration 1 | 151,636 | ||
| Calibration 2 | 152,456 | ||
| Calibration 3 | 152,294 | ||
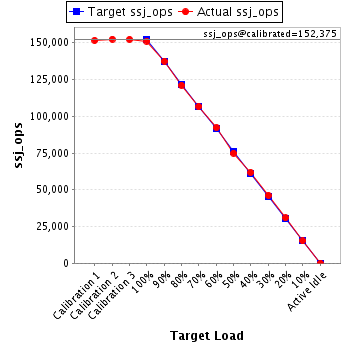
| ssj_ops@calibrated=152,375 | |||
| 100% | 99.2% | 152,375 | 151,164 |
| 90% | 90.2% | 137,138 | 137,486 |
| 80% | 79.5% | 121,900 | 121,094 |
| 70% | 70.0% | 106,663 | 106,664 |
| 60% | 60.6% | 91,425 | 92,285 |
| 50% | 49.2% | 76,188 | 74,955 |
| 40% | 40.6% | 60,950 | 61,813 |
| 30% | 30.3% | 45,713 | 46,222 |
| 20% | 20.2% | 30,475 | 30,795 |
| 10% | 10.0% | 15,238 | 15,251 |
| Active Idle | 0 | 0 | |
| Target Load | Actual Load | ssj_ops | |
|---|---|---|---|
| Target | Actual | ||
| Calibration 1 | 150,241 | ||
| Calibration 2 | 148,958 | ||
| Calibration 3 | 149,414 | ||
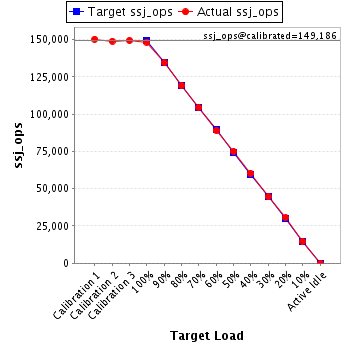
| ssj_ops@calibrated=149,186 | |||
| 100% | 99.4% | 149,186 | 148,288 |
| 90% | 90.1% | 134,267 | 134,404 |
| 80% | 79.9% | 119,349 | 119,181 |
| 70% | 70.1% | 104,430 | 104,513 |
| 60% | 59.6% | 89,511 | 88,919 |
| 50% | 50.3% | 74,593 | 75,022 |
| 40% | 40.5% | 59,674 | 60,389 |
| 30% | 29.9% | 44,756 | 44,627 |
| 20% | 20.4% | 29,837 | 30,491 |
| 10% | 9.9% | 14,919 | 14,821 |
| Active Idle | 0 | 0 | |
| Target Load | Actual Load | ssj_ops | |
|---|---|---|---|
| Target | Actual | ||
| Calibration 1 | 151,459 | ||
| Calibration 2 | 151,876 | ||
| Calibration 3 | 152,234 | ||
| ssj_ops@calibrated=152,055 | |||
| 100% | 99.5% | 152,055 | 151,337 |
| 90% | 90.3% | 136,849 | 137,281 |
| 80% | 80.5% | 121,644 | 122,398 |
| 70% | 69.7% | 106,438 | 105,936 |
| 60% | 59.2% | 91,233 | 89,976 |
| 50% | 50.1% | 76,027 | 76,222 |
| 40% | 39.6% | 60,822 | 60,192 |
| 30% | 30.4% | 45,616 | 46,152 |
| 20% | 19.9% | 30,411 | 30,206 |
| 10% | 10.1% | 15,205 | 15,417 |
| Active Idle | 0 | 0 | |

| Target Load | Actual Load | ssj_ops | |
|---|---|---|---|
| Target | Actual | ||
| Calibration 1 | 152,607 | ||
| Calibration 2 | 153,487 | ||
| Calibration 3 | 152,253 | ||
| ssj_ops@calibrated=152,870 | |||
| 100% | 99.8% | 152,870 | 152,535 |
| 90% | 90.6% | 137,583 | 138,553 |
| 80% | 79.8% | 122,296 | 121,955 |
| 70% | 70.5% | 107,009 | 107,797 |
| 60% | 60.0% | 91,722 | 91,692 |
| 50% | 50.0% | 76,435 | 76,448 |
| 40% | 39.8% | 61,148 | 60,884 |
| 30% | 30.3% | 45,861 | 46,278 |
| 20% | 19.8% | 30,574 | 30,192 |
| 10% | 9.9% | 15,287 | 15,171 |
| Active Idle | 0 | 0 | |
