SPECpower_ssj2008
Host 'M610-11' Performance Report
Copyright © 2007-2010 Standard Performance Evaluation Corporation
| Dell Inc. PowerEdge M610 | ssj_ops@100% = 902,343 ssj_ops@100% per JVM = 150,390 |
||||
| Test Sponsor: | Dell Inc. | SPEC License #: | 55 | Test Method: | Multi Node |
| Tested By: | Dell Inc. | Test Location: | Round Rock, TX, USA | Test Date: | Aug 12, 2010 |
| Hardware Availability: | Sep-2010 | Software Availability: | Jul-2009 | Publication: | Sep 9, 2010 |
| System Source: | Single Supplier | System Designation: | Server | Power Provisioning: | Line-powered |
| Target Load | Actual Load | ssj_ops | |
|---|---|---|---|
| Target | Actual | ||
| Calibration 1 | 901,819 | ||
| Calibration 2 | 904,894 | ||
| Calibration 3 | 902,080 | ||
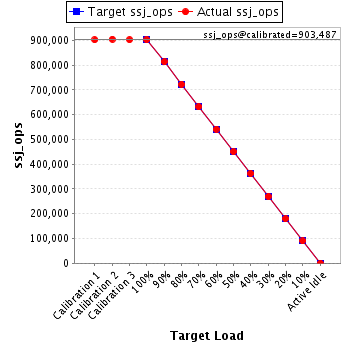
| ssj_ops@calibrated=903,487 | |||
| 100% | 99.9% | 903,487 | 902,343 |
| 90% | 90.0% | 813,138 | 813,320 |
| 80% | 80.0% | 722,789 | 722,662 |
| 70% | 69.9% | 632,441 | 631,575 |
| 60% | 59.9% | 542,092 | 541,532 |
| 50% | 49.8% | 451,743 | 450,200 |
| 40% | 40.1% | 361,395 | 362,326 |
| 30% | 29.9% | 271,046 | 269,708 |
| 20% | 19.8% | 180,697 | 178,988 |
| 10% | 10.0% | 90,349 | 90,011 |
| Active Idle | 0 | 0 | |
| Set Identifier: | sut |
| Set Description: | PowerEdge M610 |
| # of Identical Nodes: | 16 |
| Comment: | None |
| Hardware | |
|---|---|
| Hardware Vendor: | Dell Inc. |
| Model: | PowerEdge M610 |
| Form Factor: | Blade |
| CPU Name: | Intel Xeon X5670 |
| CPU Characteristics: | Six Core, 2.93 GHz, 12 MB L3 Cache |
| CPU Frequency (MHz): | 2933 |
| CPU(s) Enabled: | 12 cores, 2 chips, 6 cores/chip |
| Hardware Threads: | 24 (2 / core) |
| CPU(s) Orderable: | 1,2 chip |
| Primary Cache: | 32 KB I + 32 KB D on chip per core |
| Secondary Cache: | 256 KB I+D on chip per core |
| Tertiary Cache: | 12 MB I+D on chip per chip |
| Other Cache: | None |
| Memory Amount (GB): | 12 |
| # and size of DIMM: | 6 x 2048 MB |
| Memory Details: | 2GB 2Rx8 PC3L-10600E ECC, Slots A1-A3, B1-B3 populated |
| Power Supply Quantity and Rating (W): | None |
| Power Supply Details: | Shared |
| Disk Drive: | 1 x 50GB 2.5" SSD SATA (Dell PN Y949P) |
| Disk Controller: | Modular SATA Pass-Through |
| # and type of Network Interface Cards (NICs) Installed: | 1 x onboard dual-port Gigabit Ethernet |
| NICs Enabled in Firmware / OS / Connected: | 2/1/1 |
| Network Speed (Mbit): | 1000 |
| Keyboard: | None |
| Mouse: | None |
| Monitor: | None |
| Optical Drives: | No |
| Other Hardware: | None |
| Software | |
|---|---|
| Power Management: | Power Saver Mode in OS (See Notes) |
| Operating System (OS): | Windows 2008 Server Enterprise x64 Edition |
| OS Version: | R2 |
| Filesystem: | NTFS |
| JVM Vendor: | IBM Corporation |
| JVM Version: | IBM J9 VM (build 2.4, J2RE 1.6.0 IBM J9 2.4 Windows Server 2008 amd64-64 jvmwa64 60sr5-20090519_35743 (JIT enabled, AOT enabled) |
| JVM Command-line Options: | -Xmn1100m -Xms1500m -Xmx1500m -Xaggressive -Xcompressedrefs -Xgcpolicy:gencon -XlockReservation -Xnoloa -XtlhPrefetch -Xlp |
| JVM Affinity: | start /affinity [F,F0,F00,F000,F0000,F00000] |
| JVM Instances: | 6 |
| JVM Initial Heap (MB): | 1500 |
| JVM Maximum Heap (MB): | 1500 |
| JVM Address Bits: | 64 |
| Boot Firmware Version: | 2.1.9 |
| Management Firmware Version: | iDRAC 3.0.0 A02 / CMC 3.0.1 A00 |
| Workload Version: | SSJ 1.2.6 |
| Director Location: | Controller |
| Other Software: | None |
| JVM Instance | ssj_ops@100% |
|---|---|
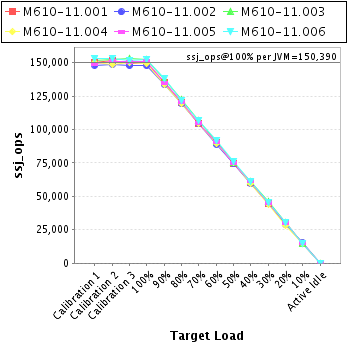
| M610-11.001 | 150,252 |
| M610-11.002 | 147,674 |
| M610-11.003 | 151,965 |
| M610-11.004 | 149,261 |
| M610-11.005 | 150,855 |
| M610-11.006 | 152,336 |
| ssj_ops@100% | 902,343 |
| ssj_ops@100% per JVM | 150,390 |
| Target Load | Actual Load | ssj_ops | |
|---|---|---|---|
| Target | Actual | ||
| Calibration 1 | 150,257 | ||
| Calibration 2 | 151,177 | ||
| Calibration 3 | 149,511 | ||
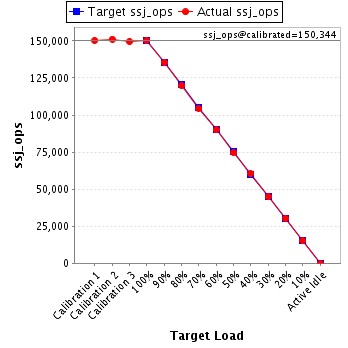
| ssj_ops@calibrated=150,344 | |||
| 100% | 99.9% | 150,344 | 150,252 |
| 90% | 90.1% | 135,309 | 135,397 |
| 80% | 79.7% | 120,275 | 119,844 |
| 70% | 69.5% | 105,241 | 104,474 |
| 60% | 59.9% | 90,206 | 90,021 |
| 50% | 49.6% | 75,172 | 74,633 |
| 40% | 40.1% | 60,137 | 60,334 |
| 30% | 29.8% | 45,103 | 44,760 |
| 20% | 20.1% | 30,069 | 30,177 |
| 10% | 10.0% | 15,034 | 15,050 |
| Active Idle | 0 | 0 | |
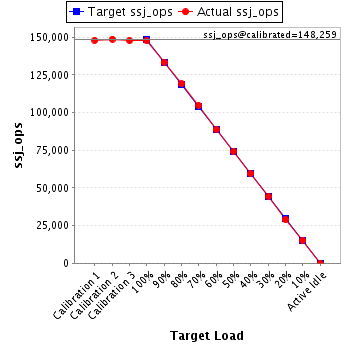
| Target Load | Actual Load | ssj_ops | |
|---|---|---|---|
| Target | Actual | ||
| Calibration 1 | 148,017 | ||
| Calibration 2 | 148,733 | ||
| Calibration 3 | 147,786 | ||
| ssj_ops@calibrated=148,259 | |||
| 100% | 99.6% | 148,259 | 147,674 |
| 90% | 90.0% | 133,434 | 133,472 |
| 80% | 80.3% | 118,608 | 119,067 |
| 70% | 70.7% | 103,782 | 104,790 |
| 60% | 60.0% | 88,956 | 88,915 |
| 50% | 50.1% | 74,130 | 74,277 |
| 40% | 40.2% | 59,304 | 59,537 |
| 30% | 30.0% | 44,478 | 44,476 |
| 20% | 19.6% | 29,652 | 29,130 |
| 10% | 10.2% | 14,826 | 15,155 |
| Active Idle | 0 | 0 | |
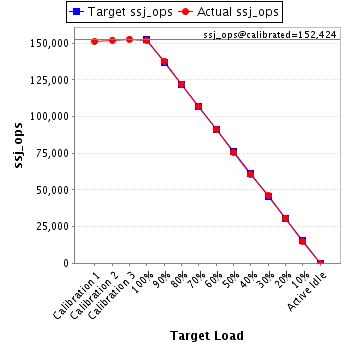
| Target Load | Actual Load | ssj_ops | |
|---|---|---|---|
| Target | Actual | ||
| Calibration 1 | 151,357 | ||
| Calibration 2 | 152,061 | ||
| Calibration 3 | 152,786 | ||
| ssj_ops@calibrated=152,424 | |||
| 100% | 99.7% | 152,424 | 151,965 |
| 90% | 90.3% | 137,181 | 137,705 |
| 80% | 80.2% | 121,939 | 122,178 |
| 70% | 70.0% | 106,697 | 106,642 |
| 60% | 59.8% | 91,454 | 91,099 |
| 50% | 49.6% | 76,212 | 75,609 |
| 40% | 39.9% | 60,969 | 60,793 |
| 30% | 30.1% | 45,727 | 45,910 |
| 20% | 20.2% | 30,485 | 30,750 |
| 10% | 9.8% | 15,242 | 15,012 |
| Active Idle | 0 | 0 | |
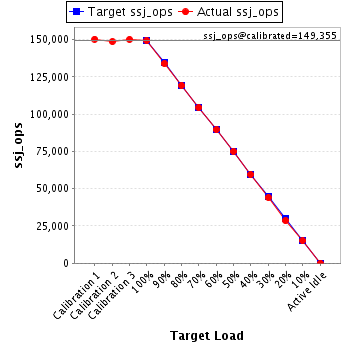
| Target Load | Actual Load | ssj_ops | |
|---|---|---|---|
| Target | Actual | ||
| Calibration 1 | 150,251 | ||
| Calibration 2 | 148,635 | ||
| Calibration 3 | 150,076 | ||
| ssj_ops@calibrated=149,355 | |||
| 100% | 99.9% | 149,355 | 149,261 |
| 90% | 89.6% | 134,420 | 133,811 |
| 80% | 79.8% | 119,484 | 119,152 |
| 70% | 69.9% | 104,549 | 104,391 |
| 60% | 60.0% | 89,613 | 89,584 |
| 50% | 50.3% | 74,678 | 75,125 |
| 40% | 39.8% | 59,742 | 59,451 |
| 30% | 29.4% | 44,807 | 43,969 |
| 20% | 19.1% | 29,871 | 28,546 |
| 10% | 10.1% | 14,936 | 15,073 |
| Active Idle | 0 | 0 | |
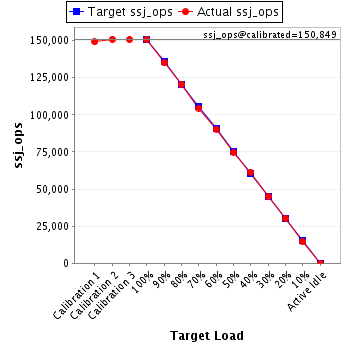
| Target Load | Actual Load | ssj_ops | |
|---|---|---|---|
| Target | Actual | ||
| Calibration 1 | 149,174 | ||
| Calibration 2 | 151,023 | ||
| Calibration 3 | 150,675 | ||
| ssj_ops@calibrated=150,849 | |||
| 100% | 100.0% | 150,849 | 150,855 |
| 90% | 89.5% | 135,764 | 135,073 |
| 80% | 80.0% | 120,679 | 120,667 |
| 70% | 69.4% | 105,594 | 104,631 |
| 60% | 60.0% | 90,509 | 90,440 |
| 50% | 49.5% | 75,424 | 74,738 |
| 40% | 40.7% | 60,340 | 61,352 |
| 30% | 29.7% | 45,255 | 44,858 |
| 20% | 20.1% | 30,170 | 30,269 |
| 10% | 9.8% | 15,085 | 14,771 |
| Active Idle | 0 | 0 | |
| Target Load | Actual Load | ssj_ops | |
|---|---|---|---|
| Target | Actual | ||
| Calibration 1 | 152,763 | ||
| Calibration 2 | 153,266 | ||
| Calibration 3 | 151,246 | ||
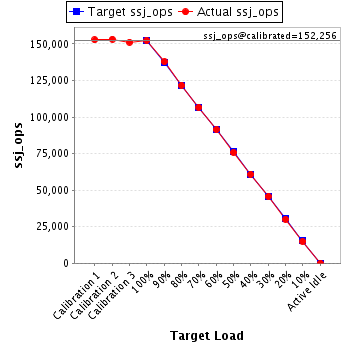
| ssj_ops@calibrated=152,256 | |||
| 100% | 100.1% | 152,256 | 152,336 |
| 90% | 90.5% | 137,030 | 137,863 |
| 80% | 80.0% | 121,805 | 121,755 |
| 70% | 70.0% | 106,579 | 106,645 |
| 60% | 60.1% | 91,353 | 91,473 |
| 50% | 49.8% | 76,128 | 75,818 |
| 40% | 40.0% | 60,902 | 60,860 |
| 30% | 30.0% | 45,677 | 45,736 |
| 20% | 19.8% | 30,451 | 30,116 |
| 10% | 9.8% | 15,226 | 14,950 |
| Active Idle | 0 | 0 | |