SPECpower_ssj2008
Host 'M610-12' Performance Report
Copyright © 2007-2010 Standard Performance Evaluation Corporation
| Dell Inc. PowerEdge M610 | ssj_ops@100% = 901,110 ssj_ops@100% per JVM = 150,185 |
||||
| Test Sponsor: | Dell Inc. | SPEC License #: | 55 | Test Method: | Multi Node |
| Tested By: | Dell Inc. | Test Location: | Round Rock, TX, USA | Test Date: | Aug 12, 2010 |
| Hardware Availability: | Sep-2010 | Software Availability: | Jul-2009 | Publication: | Sep 9, 2010 |
| System Source: | Single Supplier | System Designation: | Server | Power Provisioning: | Line-powered |
| Target Load | Actual Load | ssj_ops | |
|---|---|---|---|
| Target | Actual | ||
| Calibration 1 | 909,205 | ||
| Calibration 2 | 905,894 | ||
| Calibration 3 | 904,156 | ||
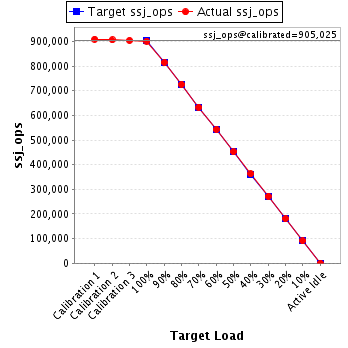
| ssj_ops@calibrated=905,025 | |||
| 100% | 99.6% | 905,025 | 901,110 |
| 90% | 90.1% | 814,522 | 815,231 |
| 80% | 80.2% | 724,020 | 725,574 |
| 70% | 69.9% | 633,517 | 632,898 |
| 60% | 60.0% | 543,015 | 543,202 |
| 50% | 50.0% | 452,512 | 452,078 |
| 40% | 40.0% | 362,010 | 362,411 |
| 30% | 30.1% | 271,507 | 272,099 |
| 20% | 20.0% | 181,005 | 180,844 |
| 10% | 10.0% | 90,502 | 90,788 |
| Active Idle | 0 | 0 | |
| Set Identifier: | sut |
| Set Description: | PowerEdge M610 |
| # of Identical Nodes: | 16 |
| Comment: | None |
| Hardware | |
|---|---|
| Hardware Vendor: | Dell Inc. |
| Model: | PowerEdge M610 |
| Form Factor: | Blade |
| CPU Name: | Intel Xeon X5670 |
| CPU Characteristics: | Six Core, 2.93 GHz, 12 MB L3 Cache |
| CPU Frequency (MHz): | 2933 |
| CPU(s) Enabled: | 12 cores, 2 chips, 6 cores/chip |
| Hardware Threads: | 24 (2 / core) |
| CPU(s) Orderable: | 1,2 chip |
| Primary Cache: | 32 KB I + 32 KB D on chip per core |
| Secondary Cache: | 256 KB I+D on chip per core |
| Tertiary Cache: | 12 MB I+D on chip per chip |
| Other Cache: | None |
| Memory Amount (GB): | 12 |
| # and size of DIMM: | 6 x 2048 MB |
| Memory Details: | 2GB 2Rx8 PC3L-10600E ECC, Slots A1-A3, B1-B3 populated |
| Power Supply Quantity and Rating (W): | None |
| Power Supply Details: | Shared |
| Disk Drive: | 1 x 50GB 2.5" SSD SATA (Dell PN Y949P) |
| Disk Controller: | Modular SATA Pass-Through |
| # and type of Network Interface Cards (NICs) Installed: | 1 x onboard dual-port Gigabit Ethernet |
| NICs Enabled in Firmware / OS / Connected: | 2/1/1 |
| Network Speed (Mbit): | 1000 |
| Keyboard: | None |
| Mouse: | None |
| Monitor: | None |
| Optical Drives: | No |
| Other Hardware: | None |
| Software | |
|---|---|
| Power Management: | Power Saver Mode in OS (See Notes) |
| Operating System (OS): | Windows 2008 Server Enterprise x64 Edition |
| OS Version: | R2 |
| Filesystem: | NTFS |
| JVM Vendor: | IBM Corporation |
| JVM Version: | IBM J9 VM (build 2.4, J2RE 1.6.0 IBM J9 2.4 Windows Server 2008 amd64-64 jvmwa64 60sr5-20090519_35743 (JIT enabled, AOT enabled) |
| JVM Command-line Options: | -Xmn1100m -Xms1500m -Xmx1500m -Xaggressive -Xcompressedrefs -Xgcpolicy:gencon -XlockReservation -Xnoloa -XtlhPrefetch -Xlp |
| JVM Affinity: | start /affinity [F,F0,F00,F000,F0000,F00000] |
| JVM Instances: | 6 |
| JVM Initial Heap (MB): | 1500 |
| JVM Maximum Heap (MB): | 1500 |
| JVM Address Bits: | 64 |
| Boot Firmware Version: | 2.1.9 |
| Management Firmware Version: | iDRAC 3.0.0 A02 / CMC 3.0.1 A00 |
| Workload Version: | SSJ 1.2.6 |
| Director Location: | Controller |
| Other Software: | None |
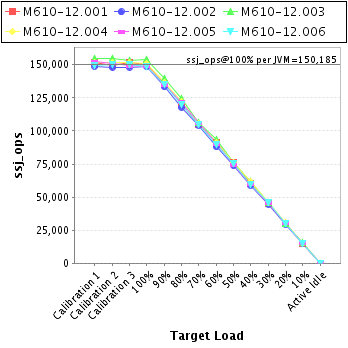
| JVM Instance | ssj_ops@100% |
|---|---|
| M610-12.001 | 150,187 |
| M610-12.002 | 148,530 |
| M610-12.003 | 154,005 |
| M610-12.004 | 150,803 |
| M610-12.005 | 148,929 |
| M610-12.006 | 148,656 |
| ssj_ops@100% | 901,110 |
| ssj_ops@100% per JVM | 150,185 |
| Target Load | Actual Load | ssj_ops | |
|---|---|---|---|
| Target | Actual | ||
| Calibration 1 | 152,020 | ||
| Calibration 2 | 149,577 | ||
| Calibration 3 | 151,802 | ||
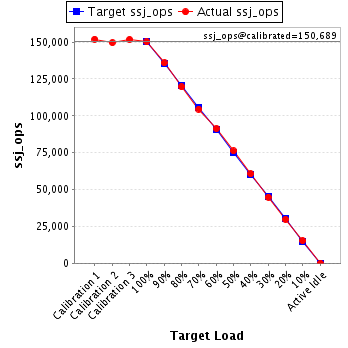
| ssj_ops@calibrated=150,689 | |||
| 100% | 99.7% | 150,689 | 150,187 |
| 90% | 90.2% | 135,620 | 135,858 |
| 80% | 79.4% | 120,551 | 119,680 |
| 70% | 69.4% | 105,482 | 104,579 |
| 60% | 60.6% | 90,414 | 91,329 |
| 50% | 50.6% | 75,345 | 76,192 |
| 40% | 40.2% | 60,276 | 60,612 |
| 30% | 29.8% | 45,207 | 44,865 |
| 20% | 19.8% | 30,138 | 29,792 |
| 10% | 10.1% | 15,069 | 15,259 |
| Active Idle | 0 | 0 | |
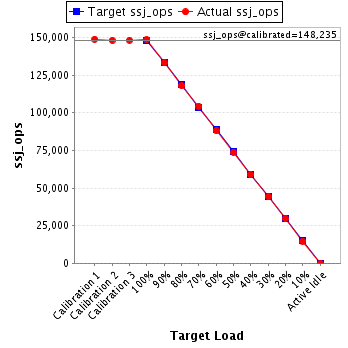
| Target Load | Actual Load | ssj_ops | |
|---|---|---|---|
| Target | Actual | ||
| Calibration 1 | 148,910 | ||
| Calibration 2 | 148,186 | ||
| Calibration 3 | 148,284 | ||
| ssj_ops@calibrated=148,235 | |||
| 100% | 100.2% | 148,235 | 148,530 |
| 90% | 89.9% | 133,411 | 133,256 |
| 80% | 79.6% | 118,588 | 117,970 |
| 70% | 70.4% | 103,764 | 104,431 |
| 60% | 59.4% | 88,941 | 88,006 |
| 50% | 49.8% | 74,117 | 73,754 |
| 40% | 39.8% | 59,294 | 59,047 |
| 30% | 30.0% | 44,470 | 44,463 |
| 20% | 19.9% | 29,647 | 29,565 |
| 10% | 9.9% | 14,823 | 14,741 |
| Active Idle | 0 | 0 | |
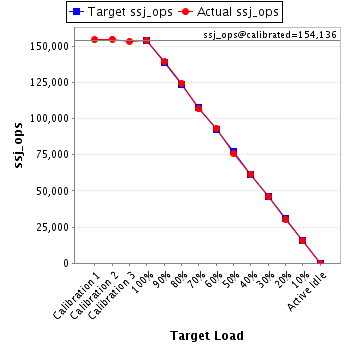
| Target Load | Actual Load | ssj_ops | |
|---|---|---|---|
| Target | Actual | ||
| Calibration 1 | 154,660 | ||
| Calibration 2 | 154,956 | ||
| Calibration 3 | 153,316 | ||
| ssj_ops@calibrated=154,136 | |||
| 100% | 99.9% | 154,136 | 154,005 |
| 90% | 90.4% | 138,722 | 139,295 |
| 80% | 80.7% | 123,309 | 124,434 |
| 70% | 69.2% | 107,895 | 106,680 |
| 60% | 60.4% | 92,482 | 93,159 |
| 50% | 49.4% | 77,068 | 76,176 |
| 40% | 40.0% | 61,654 | 61,606 |
| 30% | 29.9% | 46,241 | 46,083 |
| 20% | 19.7% | 30,827 | 30,414 |
| 10% | 10.1% | 15,414 | 15,558 |
| Active Idle | 0 | 0 | |
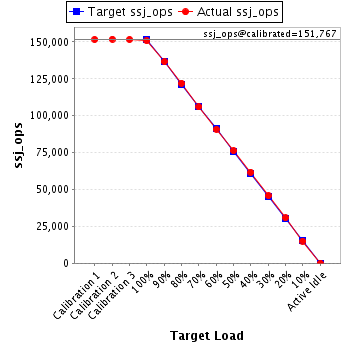
| Target Load | Actual Load | ssj_ops | |
|---|---|---|---|
| Target | Actual | ||
| Calibration 1 | 151,679 | ||
| Calibration 2 | 151,901 | ||
| Calibration 3 | 151,634 | ||
| ssj_ops@calibrated=151,767 | |||
| 100% | 99.4% | 151,767 | 150,803 |
| 90% | 90.0% | 136,590 | 136,617 |
| 80% | 80.4% | 121,414 | 122,063 |
| 70% | 69.8% | 106,237 | 105,949 |
| 60% | 59.9% | 91,060 | 90,874 |
| 50% | 50.2% | 75,884 | 76,229 |
| 40% | 40.7% | 60,707 | 61,779 |
| 30% | 30.2% | 45,530 | 45,771 |
| 20% | 20.2% | 30,353 | 30,714 |
| 10% | 9.9% | 15,177 | 15,089 |
| Active Idle | 0 | 0 | |
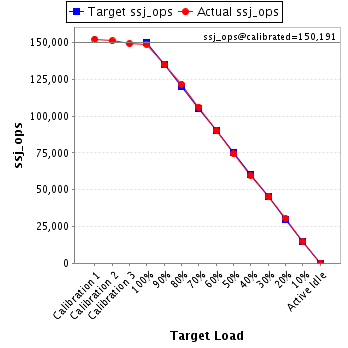
| Target Load | Actual Load | ssj_ops | |
|---|---|---|---|
| Target | Actual | ||
| Calibration 1 | 152,315 | ||
| Calibration 2 | 151,195 | ||
| Calibration 3 | 149,187 | ||
| ssj_ops@calibrated=150,191 | |||
| 100% | 99.2% | 150,191 | 148,929 |
| 90% | 89.9% | 135,172 | 135,022 |
| 80% | 81.0% | 120,153 | 121,659 |
| 70% | 70.7% | 105,134 | 106,160 |
| 60% | 60.0% | 90,115 | 90,124 |
| 50% | 49.6% | 75,096 | 74,528 |
| 40% | 39.8% | 60,076 | 59,773 |
| 30% | 30.2% | 45,057 | 45,324 |
| 20% | 20.2% | 30,038 | 30,354 |
| 10% | 10.0% | 15,019 | 15,036 |
| Active Idle | 0 | 0 | |
| Target Load | Actual Load | ssj_ops | |
|---|---|---|---|
| Target | Actual | ||
| Calibration 1 | 149,621 | ||
| Calibration 2 | 150,081 | ||
| Calibration 3 | 149,933 | ||
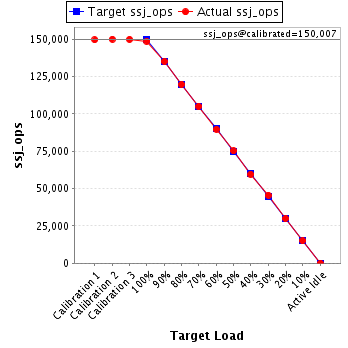
| ssj_ops@calibrated=150,007 | |||
| 100% | 99.1% | 150,007 | 148,656 |
| 90% | 90.1% | 135,006 | 135,183 |
| 80% | 79.8% | 120,005 | 119,767 |
| 70% | 70.1% | 105,005 | 105,099 |
| 60% | 59.8% | 90,004 | 89,710 |
| 50% | 50.1% | 75,003 | 75,199 |
| 40% | 39.7% | 60,003 | 59,594 |
| 30% | 30.4% | 45,002 | 45,594 |
| 20% | 20.0% | 30,001 | 30,005 |
| 10% | 10.1% | 15,001 | 15,104 |
| Active Idle | 0 | 0 | |