SPECpower_ssj2008
Host 'M610-13' Performance Report
Copyright © 2007-2010 Standard Performance Evaluation Corporation
| Dell Inc. PowerEdge M610 | ssj_ops@100% = 895,242 ssj_ops@100% per JVM = 149,207 |
||||
| Test Sponsor: | Dell Inc. | SPEC License #: | 55 | Test Method: | Multi Node |
| Tested By: | Dell Inc. | Test Location: | Round Rock, TX, USA | Test Date: | Aug 12, 2010 |
| Hardware Availability: | Sep-2010 | Software Availability: | Jul-2009 | Publication: | Sep 9, 2010 |
| System Source: | Single Supplier | System Designation: | Server | Power Provisioning: | Line-powered |
| Target Load | Actual Load | ssj_ops | |
|---|---|---|---|
| Target | Actual | ||
| Calibration 1 | 900,683 | ||
| Calibration 2 | 899,364 | ||
| Calibration 3 | 900,568 | ||
| ssj_ops@calibrated=899,966 | |||
| 100% | 99.5% | 899,966 | 895,242 |
| 90% | 90.3% | 809,969 | 812,953 |
| 80% | 79.8% | 719,973 | 718,290 |
| 70% | 69.6% | 629,976 | 626,565 |
| 60% | 59.9% | 539,980 | 539,351 |
| 50% | 50.3% | 449,983 | 452,272 |
| 40% | 40.0% | 359,986 | 359,852 |
| 30% | 29.8% | 269,990 | 267,827 |
| 20% | 20.1% | 179,993 | 180,654 |
| 10% | 10.2% | 89,997 | 91,390 |
| Active Idle | 0 | 0 | |

| Set Identifier: | sut |
| Set Description: | PowerEdge M610 |
| # of Identical Nodes: | 16 |
| Comment: | None |
| Hardware | |
|---|---|
| Hardware Vendor: | Dell Inc. |
| Model: | PowerEdge M610 |
| Form Factor: | Blade |
| CPU Name: | Intel Xeon X5670 |
| CPU Characteristics: | Six Core, 2.93 GHz, 12 MB L3 Cache |
| CPU Frequency (MHz): | 2933 |
| CPU(s) Enabled: | 12 cores, 2 chips, 6 cores/chip |
| Hardware Threads: | 24 (2 / core) |
| CPU(s) Orderable: | 1,2 chip |
| Primary Cache: | 32 KB I + 32 KB D on chip per core |
| Secondary Cache: | 256 KB I+D on chip per core |
| Tertiary Cache: | 12 MB I+D on chip per chip |
| Other Cache: | None |
| Memory Amount (GB): | 12 |
| # and size of DIMM: | 6 x 2048 MB |
| Memory Details: | 2GB 2Rx8 PC3L-10600E ECC, Slots A1-A3, B1-B3 populated |
| Power Supply Quantity and Rating (W): | None |
| Power Supply Details: | Shared |
| Disk Drive: | 1 x 50GB 2.5" SSD SATA (Dell PN Y949P) |
| Disk Controller: | Modular SATA Pass-Through |
| # and type of Network Interface Cards (NICs) Installed: | 1 x onboard dual-port Gigabit Ethernet |
| NICs Enabled in Firmware / OS / Connected: | 2/1/1 |
| Network Speed (Mbit): | 1000 |
| Keyboard: | None |
| Mouse: | None |
| Monitor: | None |
| Optical Drives: | No |
| Other Hardware: | None |
| Software | |
|---|---|
| Power Management: | Power Saver Mode in OS (See Notes) |
| Operating System (OS): | Windows 2008 Server Enterprise x64 Edition |
| OS Version: | R2 |
| Filesystem: | NTFS |
| JVM Vendor: | IBM Corporation |
| JVM Version: | IBM J9 VM (build 2.4, J2RE 1.6.0 IBM J9 2.4 Windows Server 2008 amd64-64 jvmwa64 60sr5-20090519_35743 (JIT enabled, AOT enabled) |
| JVM Command-line Options: | -Xmn1100m -Xms1500m -Xmx1500m -Xaggressive -Xcompressedrefs -Xgcpolicy:gencon -XlockReservation -Xnoloa -XtlhPrefetch -Xlp |
| JVM Affinity: | start /affinity [F,F0,F00,F000,F0000,F00000] |
| JVM Instances: | 6 |
| JVM Initial Heap (MB): | 1500 |
| JVM Maximum Heap (MB): | 1500 |
| JVM Address Bits: | 64 |
| Boot Firmware Version: | 2.1.9 |
| Management Firmware Version: | iDRAC 3.0.0 A02 / CMC 3.0.1 A00 |
| Workload Version: | SSJ 1.2.6 |
| Director Location: | Controller |
| Other Software: | None |
| JVM Instance | ssj_ops@100% |
|---|---|
| M610-13.001 | 151,139 |
| M610-13.002 | 150,727 |
| M610-13.003 | 144,957 |
| M610-13.004 | 147,583 |
| M610-13.005 | 150,283 |
| M610-13.006 | 150,553 |
| ssj_ops@100% | 895,242 |
| ssj_ops@100% per JVM | 149,207 |

| Target Load | Actual Load | ssj_ops | |
|---|---|---|---|
| Target | Actual | ||
| Calibration 1 | 152,005 | ||
| Calibration 2 | 151,716 | ||
| Calibration 3 | 152,070 | ||
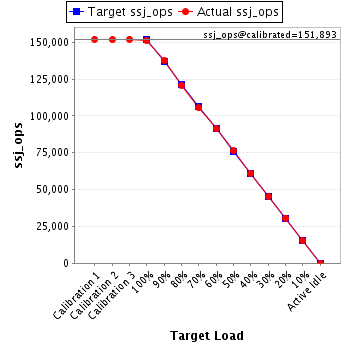
| ssj_ops@calibrated=151,893 | |||
| 100% | 99.5% | 151,893 | 151,139 |
| 90% | 90.4% | 136,704 | 137,346 |
| 80% | 79.5% | 121,515 | 120,794 |
| 70% | 69.4% | 106,325 | 105,420 |
| 60% | 60.0% | 91,136 | 91,199 |
| 50% | 50.2% | 75,947 | 76,225 |
| 40% | 40.3% | 60,757 | 61,206 |
| 30% | 29.8% | 45,568 | 45,291 |
| 20% | 20.2% | 30,379 | 30,663 |
| 10% | 10.0% | 15,189 | 15,218 |
| Active Idle | 0 | 0 | |
| Target Load | Actual Load | ssj_ops | |
|---|---|---|---|
| Target | Actual | ||
| Calibration 1 | 150,517 | ||
| Calibration 2 | 152,333 | ||
| Calibration 3 | 150,841 | ||
| ssj_ops@calibrated=151,587 | |||
| 100% | 99.4% | 151,587 | 150,727 |
| 90% | 90.0% | 136,428 | 136,493 |
| 80% | 79.5% | 121,270 | 120,487 |
| 70% | 69.4% | 106,111 | 105,171 |
| 60% | 59.5% | 90,952 | 90,173 |
| 50% | 50.3% | 75,794 | 76,205 |
| 40% | 39.6% | 60,635 | 59,974 |
| 30% | 30.1% | 45,476 | 45,635 |
| 20% | 20.2% | 30,317 | 30,621 |
| 10% | 10.2% | 15,159 | 15,503 |
| Active Idle | 0 | 0 | |

| Target Load | Actual Load | ssj_ops | |
|---|---|---|---|
| Target | Actual | ||
| Calibration 1 | 146,469 | ||
| Calibration 2 | 145,988 | ||
| Calibration 3 | 145,450 | ||
| ssj_ops@calibrated=145,719 | |||
| 100% | 99.5% | 145,719 | 144,957 |
| 90% | 90.7% | 131,147 | 132,202 |
| 80% | 79.6% | 116,575 | 115,979 |
| 70% | 69.7% | 102,003 | 101,587 |
| 60% | 59.4% | 87,431 | 86,535 |
| 50% | 50.2% | 72,860 | 73,119 |
| 40% | 40.3% | 58,288 | 58,683 |
| 30% | 29.7% | 43,716 | 43,347 |
| 20% | 19.9% | 29,144 | 28,943 |
| 10% | 9.9% | 14,572 | 14,367 |
| Active Idle | 0 | 0 | |

| Target Load | Actual Load | ssj_ops | |
|---|---|---|---|
| Target | Actual | ||
| Calibration 1 | 149,936 | ||
| Calibration 2 | 147,592 | ||
| Calibration 3 | 149,171 | ||
| ssj_ops@calibrated=148,382 | |||
| 100% | 99.5% | 148,382 | 147,583 |
| 90% | 91.1% | 133,543 | 135,218 |
| 80% | 79.8% | 118,705 | 118,434 |
| 70% | 70.4% | 103,867 | 104,408 |
| 60% | 60.0% | 89,029 | 88,971 |
| 50% | 50.2% | 74,191 | 74,520 |
| 40% | 40.0% | 59,353 | 59,306 |
| 30% | 29.8% | 44,514 | 44,176 |
| 20% | 20.0% | 29,676 | 29,696 |
| 10% | 10.0% | 14,838 | 14,784 |
| Active Idle | 0 | 0 | |

| Target Load | Actual Load | ssj_ops | |
|---|---|---|---|
| Target | Actual | ||
| Calibration 1 | 151,461 | ||
| Calibration 2 | 151,542 | ||
| Calibration 3 | 151,379 | ||
| ssj_ops@calibrated=151,461 | |||
| 100% | 99.2% | 151,461 | 150,283 |
| 90% | 90.0% | 136,314 | 136,388 |
| 80% | 80.5% | 121,168 | 121,956 |
| 70% | 69.5% | 106,022 | 105,333 |
| 60% | 60.4% | 90,876 | 91,542 |
| 50% | 50.2% | 75,730 | 75,982 |
| 40% | 40.2% | 60,584 | 60,831 |
| 30% | 29.6% | 45,438 | 44,761 |
| 20% | 20.0% | 30,292 | 30,233 |
| 10% | 10.3% | 15,146 | 15,642 |
| Active Idle | 0 | 0 | |

| Target Load | Actual Load | ssj_ops | |
|---|---|---|---|
| Target | Actual | ||
| Calibration 1 | 150,294 | ||
| Calibration 2 | 150,192 | ||
| Calibration 3 | 151,656 | ||
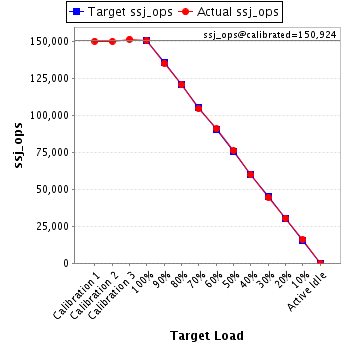
| ssj_ops@calibrated=150,924 | |||
| 100% | 99.8% | 150,924 | 150,553 |
| 90% | 89.7% | 135,832 | 135,306 |
| 80% | 79.9% | 120,739 | 120,641 |
| 70% | 69.3% | 105,647 | 104,645 |
| 60% | 60.2% | 90,554 | 90,930 |
| 50% | 50.5% | 75,462 | 76,221 |
| 40% | 39.7% | 60,370 | 59,851 |
| 30% | 29.6% | 45,277 | 44,618 |
| 20% | 20.2% | 30,185 | 30,498 |
| 10% | 10.5% | 15,092 | 15,878 |
| Active Idle | 0 | 0 | |