
SPECpower_ssj2008
Host 'M610-14' Performance Report
Copyright © 2007-2010 Standard Performance Evaluation Corporation
| Dell Inc. PowerEdge M610 | ssj_ops@100% = 898,232 ssj_ops@100% per JVM = 149,705 |
||||
| Test Sponsor: | Dell Inc. | SPEC License #: | 55 | Test Method: | Multi Node |
| Tested By: | Dell Inc. | Test Location: | Round Rock, TX, USA | Test Date: | Aug 12, 2010 |
| Hardware Availability: | Sep-2010 | Software Availability: | Jul-2009 | Publication: | Sep 9, 2010 |
| System Source: | Single Supplier | System Designation: | Server | Power Provisioning: | Line-powered |
| Target Load | Actual Load | ssj_ops | |
|---|---|---|---|
| Target | Actual | ||
| Calibration 1 | 899,172 | ||
| Calibration 2 | 904,826 | ||
| Calibration 3 | 902,200 | ||
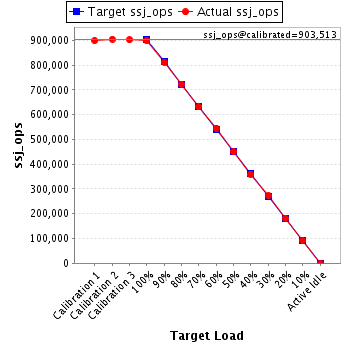
| ssj_ops@calibrated=903,513 | |||
| 100% | 99.4% | 903,513 | 898,232 |
| 90% | 89.8% | 813,162 | 811,536 |
| 80% | 80.0% | 722,810 | 723,236 |
| 70% | 70.0% | 632,459 | 632,058 |
| 60% | 60.4% | 542,108 | 545,899 |
| 50% | 49.8% | 451,757 | 449,513 |
| 40% | 39.9% | 361,405 | 360,292 |
| 30% | 30.2% | 271,054 | 272,711 |
| 20% | 20.1% | 180,703 | 181,812 |
| 10% | 10.1% | 90,351 | 91,221 |
| Active Idle | 0 | 0 | |
| Set Identifier: | sut |
| Set Description: | PowerEdge M610 |
| # of Identical Nodes: | 16 |
| Comment: | None |
| Hardware | |
|---|---|
| Hardware Vendor: | Dell Inc. |
| Model: | PowerEdge M610 |
| Form Factor: | Blade |
| CPU Name: | Intel Xeon X5670 |
| CPU Characteristics: | Six Core, 2.93 GHz, 12 MB L3 Cache |
| CPU Frequency (MHz): | 2933 |
| CPU(s) Enabled: | 12 cores, 2 chips, 6 cores/chip |
| Hardware Threads: | 24 (2 / core) |
| CPU(s) Orderable: | 1,2 chip |
| Primary Cache: | 32 KB I + 32 KB D on chip per core |
| Secondary Cache: | 256 KB I+D on chip per core |
| Tertiary Cache: | 12 MB I+D on chip per chip |
| Other Cache: | None |
| Memory Amount (GB): | 12 |
| # and size of DIMM: | 6 x 2048 MB |
| Memory Details: | 2GB 2Rx8 PC3L-10600E ECC, Slots A1-A3, B1-B3 populated |
| Power Supply Quantity and Rating (W): | None |
| Power Supply Details: | Shared |
| Disk Drive: | 1 x 50GB 2.5" SSD SATA (Dell PN Y949P) |
| Disk Controller: | Modular SATA Pass-Through |
| # and type of Network Interface Cards (NICs) Installed: | 1 x onboard dual-port Gigabit Ethernet |
| NICs Enabled in Firmware / OS / Connected: | 2/1/1 |
| Network Speed (Mbit): | 1000 |
| Keyboard: | None |
| Mouse: | None |
| Monitor: | None |
| Optical Drives: | No |
| Other Hardware: | None |
| Software | |
|---|---|
| Power Management: | Power Saver Mode in OS (See Notes) |
| Operating System (OS): | Windows 2008 Server Enterprise x64 Edition |
| OS Version: | R2 |
| Filesystem: | NTFS |
| JVM Vendor: | IBM Corporation |
| JVM Version: | IBM J9 VM (build 2.4, J2RE 1.6.0 IBM J9 2.4 Windows Server 2008 amd64-64 jvmwa64 60sr5-20090519_35743 (JIT enabled, AOT enabled) |
| JVM Command-line Options: | -Xmn1100m -Xms1500m -Xmx1500m -Xaggressive -Xcompressedrefs -Xgcpolicy:gencon -XlockReservation -Xnoloa -XtlhPrefetch -Xlp |
| JVM Affinity: | start /affinity [F,F0,F00,F000,F0000,F00000] |
| JVM Instances: | 6 |
| JVM Initial Heap (MB): | 1500 |
| JVM Maximum Heap (MB): | 1500 |
| JVM Address Bits: | 64 |
| Boot Firmware Version: | 2.1.9 |
| Management Firmware Version: | iDRAC 3.0.0 A02 / CMC 3.0.1 A00 |
| Workload Version: | SSJ 1.2.6 |
| Director Location: | Controller |
| Other Software: | None |
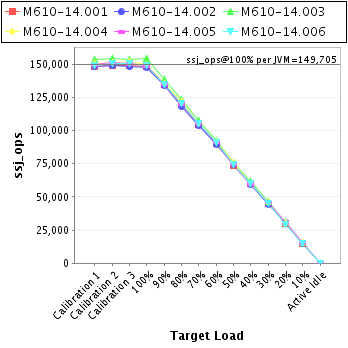
| JVM Instance | ssj_ops@100% |
|---|---|
| M610-14.001 | 148,448 |
| M610-14.002 | 147,609 |
| M610-14.003 | 154,437 |
| M610-14.004 | 149,717 |
| M610-14.005 | 148,879 |
| M610-14.006 | 149,141 |
| ssj_ops@100% | 898,232 |
| ssj_ops@100% per JVM | 149,705 |
| Target Load | Actual Load | ssj_ops | |
|---|---|---|---|
| Target | Actual | ||
| Calibration 1 | 148,337 | ||
| Calibration 2 | 149,115 | ||
| Calibration 3 | 149,184 | ||
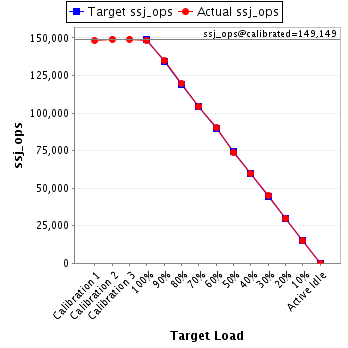
| ssj_ops@calibrated=149,149 | |||
| 100% | 99.5% | 149,149 | 148,448 |
| 90% | 90.3% | 134,235 | 134,730 |
| 80% | 80.2% | 119,320 | 119,592 |
| 70% | 70.0% | 104,405 | 104,405 |
| 60% | 60.4% | 89,490 | 90,057 |
| 50% | 49.4% | 74,575 | 73,728 |
| 40% | 40.1% | 59,660 | 59,766 |
| 30% | 30.1% | 44,745 | 44,967 |
| 20% | 20.0% | 29,830 | 29,812 |
| 10% | 10.0% | 14,915 | 14,929 |
| Active Idle | 0 | 0 | |
| Target Load | Actual Load | ssj_ops | |
|---|---|---|---|
| Target | Actual | ||
| Calibration 1 | 148,489 | ||
| Calibration 2 | 148,973 | ||
| Calibration 3 | 147,868 | ||
| ssj_ops@calibrated=148,420 | |||
| 100% | 99.5% | 148,420 | 147,609 |
| 90% | 90.1% | 133,578 | 133,674 |
| 80% | 79.6% | 118,736 | 118,185 |
| 70% | 69.9% | 103,894 | 103,687 |
| 60% | 60.4% | 89,052 | 89,664 |
| 50% | 50.3% | 74,210 | 74,630 |
| 40% | 39.9% | 59,368 | 59,225 |
| 30% | 30.0% | 44,526 | 44,517 |
| 20% | 20.5% | 29,684 | 30,500 |
| 10% | 10.0% | 14,842 | 14,810 |
| Active Idle | 0 | 0 | |

| Target Load | Actual Load | ssj_ops | |
|---|---|---|---|
| Target | Actual | ||
| Calibration 1 | 153,264 | ||
| Calibration 2 | 154,375 | ||
| Calibration 3 | 153,228 | ||
| ssj_ops@calibrated=153,802 | |||
| 100% | 100.4% | 153,802 | 154,437 |
| 90% | 90.0% | 138,422 | 138,428 |
| 80% | 80.0% | 123,041 | 123,058 |
| 70% | 70.0% | 107,661 | 107,677 |
| 60% | 60.1% | 92,281 | 92,416 |
| 50% | 49.4% | 76,901 | 76,030 |
| 40% | 39.9% | 61,521 | 61,309 |
| 30% | 30.1% | 46,141 | 46,304 |
| 20% | 20.1% | 30,760 | 30,975 |
| 10% | 10.0% | 15,380 | 15,437 |
| Active Idle | 0 | 0 | |

| Target Load | Actual Load | ssj_ops | |
|---|---|---|---|
| Target | Actual | ||
| Calibration 1 | 150,382 | ||
| Calibration 2 | 151,394 | ||
| Calibration 3 | 151,639 | ||
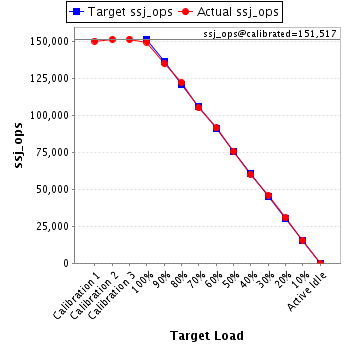
| ssj_ops@calibrated=151,517 | |||
| 100% | 98.8% | 151,517 | 149,717 |
| 90% | 89.2% | 136,365 | 135,214 |
| 80% | 80.6% | 121,213 | 122,126 |
| 70% | 69.5% | 106,062 | 105,256 |
| 60% | 60.5% | 90,910 | 91,621 |
| 50% | 50.1% | 75,758 | 75,956 |
| 40% | 39.7% | 60,607 | 60,212 |
| 30% | 30.3% | 45,455 | 45,869 |
| 20% | 20.3% | 30,303 | 30,713 |
| 10% | 10.3% | 15,152 | 15,609 |
| Active Idle | 0 | 0 | |
| Target Load | Actual Load | ssj_ops | |
|---|---|---|---|
| Target | Actual | ||
| Calibration 1 | 149,590 | ||
| Calibration 2 | 150,888 | ||
| Calibration 3 | 150,151 | ||
| ssj_ops@calibrated=150,519 | |||
| 100% | 98.9% | 150,519 | 148,879 |
| 90% | 89.5% | 135,467 | 134,742 |
| 80% | 79.6% | 120,416 | 119,836 |
| 70% | 70.2% | 105,364 | 105,596 |
| 60% | 60.6% | 90,312 | 91,281 |
| 50% | 49.5% | 75,260 | 74,545 |
| 40% | 39.5% | 60,208 | 59,408 |
| 30% | 30.4% | 45,156 | 45,829 |
| 20% | 20.2% | 30,104 | 30,337 |
| 10% | 10.1% | 15,052 | 15,262 |
| Active Idle | 0 | 0 | |

| Target Load | Actual Load | ssj_ops | |
|---|---|---|---|
| Target | Actual | ||
| Calibration 1 | 149,109 | ||
| Calibration 2 | 150,081 | ||
| Calibration 3 | 150,130 | ||
| ssj_ops@calibrated=150,105 | |||
| 100% | 99.4% | 150,105 | 149,141 |
| 90% | 89.8% | 135,095 | 134,747 |
| 80% | 80.2% | 120,084 | 120,440 |
| 70% | 70.2% | 105,074 | 105,438 |
| 60% | 60.5% | 90,063 | 90,861 |
| 50% | 49.7% | 75,053 | 74,624 |
| 40% | 40.2% | 60,042 | 60,372 |
| 30% | 30.1% | 45,032 | 45,226 |
| 20% | 19.6% | 30,021 | 29,475 |
| 10% | 10.1% | 15,011 | 15,173 |
| Active Idle | 0 | 0 | |
