SPECpower_ssj2008
Host 'M610-15' Performance Report
Copyright © 2007-2010 Standard Performance Evaluation Corporation
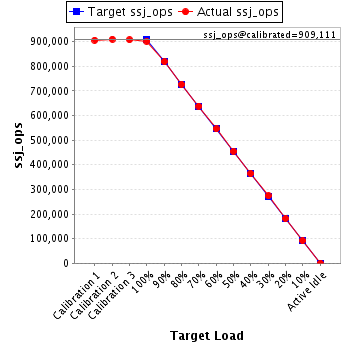
| Dell Inc. PowerEdge M610 | ssj_ops@100% = 902,147 ssj_ops@100% per JVM = 150,358 |
||||
| Test Sponsor: | Dell Inc. | SPEC License #: | 55 | Test Method: | Multi Node |
| Tested By: | Dell Inc. | Test Location: | Round Rock, TX, USA | Test Date: | Aug 12, 2010 |
| Hardware Availability: | Sep-2010 | Software Availability: | Jul-2009 | Publication: | Sep 9, 2010 |
| System Source: | Single Supplier | System Designation: | Server | Power Provisioning: | Line-powered |
| Target Load | Actual Load | ssj_ops | |
|---|---|---|---|
| Target | Actual | ||
| Calibration 1 | 906,728 | ||
| Calibration 2 | 910,425 | ||
| Calibration 3 | 907,797 | ||
| ssj_ops@calibrated=909,111 | |||
| 100% | 99.2% | 909,111 | 902,147 |
| 90% | 90.1% | 818,200 | 819,000 |
| 80% | 80.0% | 727,289 | 726,979 |
| 70% | 70.3% | 636,378 | 638,651 |
| 60% | 60.0% | 545,467 | 545,864 |
| 50% | 50.1% | 454,556 | 455,597 |
| 40% | 40.1% | 363,644 | 364,357 |
| 30% | 30.1% | 272,733 | 273,535 |
| 20% | 20.0% | 181,822 | 181,752 |
| 10% | 10.1% | 90,911 | 91,962 |
| Active Idle | 0 | 0 | |
| Set Identifier: | sut |
| Set Description: | PowerEdge M610 |
| # of Identical Nodes: | 16 |
| Comment: | None |
| Hardware | |
|---|---|
| Hardware Vendor: | Dell Inc. |
| Model: | PowerEdge M610 |
| Form Factor: | Blade |
| CPU Name: | Intel Xeon X5670 |
| CPU Characteristics: | Six Core, 2.93 GHz, 12 MB L3 Cache |
| CPU Frequency (MHz): | 2933 |
| CPU(s) Enabled: | 12 cores, 2 chips, 6 cores/chip |
| Hardware Threads: | 24 (2 / core) |
| CPU(s) Orderable: | 1,2 chip |
| Primary Cache: | 32 KB I + 32 KB D on chip per core |
| Secondary Cache: | 256 KB I+D on chip per core |
| Tertiary Cache: | 12 MB I+D on chip per chip |
| Other Cache: | None |
| Memory Amount (GB): | 12 |
| # and size of DIMM: | 6 x 2048 MB |
| Memory Details: | 2GB 2Rx8 PC3L-10600E ECC, Slots A1-A3, B1-B3 populated |
| Power Supply Quantity and Rating (W): | None |
| Power Supply Details: | Shared |
| Disk Drive: | 1 x 50GB 2.5" SSD SATA (Dell PN Y949P) |
| Disk Controller: | Modular SATA Pass-Through |
| # and type of Network Interface Cards (NICs) Installed: | 1 x onboard dual-port Gigabit Ethernet |
| NICs Enabled in Firmware / OS / Connected: | 2/1/1 |
| Network Speed (Mbit): | 1000 |
| Keyboard: | None |
| Mouse: | None |
| Monitor: | None |
| Optical Drives: | No |
| Other Hardware: | None |
| Software | |
|---|---|
| Power Management: | Power Saver Mode in OS (See Notes) |
| Operating System (OS): | Windows 2008 Server Enterprise x64 Edition |
| OS Version: | R2 |
| Filesystem: | NTFS |
| JVM Vendor: | IBM Corporation |
| JVM Version: | IBM J9 VM (build 2.4, J2RE 1.6.0 IBM J9 2.4 Windows Server 2008 amd64-64 jvmwa64 60sr5-20090519_35743 (JIT enabled, AOT enabled) |
| JVM Command-line Options: | -Xmn1100m -Xms1500m -Xmx1500m -Xaggressive -Xcompressedrefs -Xgcpolicy:gencon -XlockReservation -Xnoloa -XtlhPrefetch -Xlp |
| JVM Affinity: | start /affinity [F,F0,F00,F000,F0000,F00000] |
| JVM Instances: | 6 |
| JVM Initial Heap (MB): | 1500 |
| JVM Maximum Heap (MB): | 1500 |
| JVM Address Bits: | 64 |
| Boot Firmware Version: | 2.1.9 |
| Management Firmware Version: | iDRAC 3.0.0 A02 / CMC 3.0.1 A00 |
| Workload Version: | SSJ 1.2.6 |
| Director Location: | Controller |
| Other Software: | None |
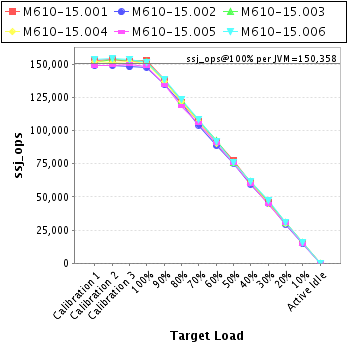
| JVM Instance | ssj_ops@100% |
|---|---|
| M610-15.001 | 152,306 |
| M610-15.002 | 147,511 |
| M610-15.003 | 152,185 |
| M610-15.004 | 150,358 |
| M610-15.005 | 148,401 |
| M610-15.006 | 151,386 |
| ssj_ops@100% | 902,147 |
| ssj_ops@100% per JVM | 150,358 |
| Target Load | Actual Load | ssj_ops | |
|---|---|---|---|
| Target | Actual | ||
| Calibration 1 | 152,816 | ||
| Calibration 2 | 153,489 | ||
| Calibration 3 | 151,917 | ||
| ssj_ops@calibrated=152,703 | |||
| 100% | 99.7% | 152,703 | 152,306 |
| 90% | 90.4% | 137,433 | 138,071 |
| 80% | 79.3% | 122,162 | 121,072 |
| 70% | 70.1% | 106,892 | 106,973 |
| 60% | 60.3% | 91,622 | 92,047 |
| 50% | 50.7% | 76,352 | 77,417 |
| 40% | 40.0% | 61,081 | 61,054 |
| 30% | 29.9% | 45,811 | 45,662 |
| 20% | 20.0% | 30,541 | 30,527 |
| 10% | 10.2% | 15,270 | 15,554 |
| Active Idle | 0 | 0 | |

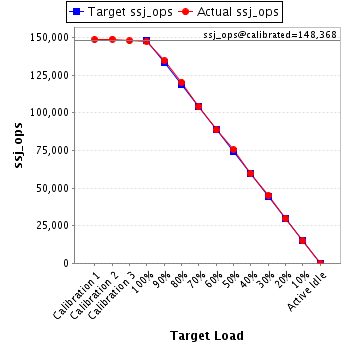
| Target Load | Actual Load | ssj_ops | |
|---|---|---|---|
| Target | Actual | ||
| Calibration 1 | 148,710 | ||
| Calibration 2 | 148,936 | ||
| Calibration 3 | 147,801 | ||
| ssj_ops@calibrated=148,368 | |||
| 100% | 99.4% | 148,368 | 147,511 |
| 90% | 90.7% | 133,531 | 134,566 |
| 80% | 81.1% | 118,695 | 120,324 |
| 70% | 70.2% | 103,858 | 104,081 |
| 60% | 59.7% | 89,021 | 88,610 |
| 50% | 50.8% | 74,184 | 75,422 |
| 40% | 40.2% | 59,347 | 59,659 |
| 30% | 30.3% | 44,510 | 44,980 |
| 20% | 19.9% | 29,674 | 29,477 |
| 10% | 10.0% | 14,837 | 14,826 |
| Active Idle | 0 | 0 | |
| Target Load | Actual Load | ssj_ops | |
|---|---|---|---|
| Target | Actual | ||
| Calibration 1 | 151,205 | ||
| Calibration 2 | 153,251 | ||
| Calibration 3 | 152,768 | ||
| ssj_ops@calibrated=153,010 | |||
| 100% | 99.5% | 153,010 | 152,185 |
| 90% | 89.6% | 137,709 | 137,149 |
| 80% | 79.9% | 122,408 | 122,296 |
| 70% | 70.2% | 107,107 | 107,398 |
| 60% | 60.5% | 91,806 | 92,628 |
| 50% | 49.5% | 76,505 | 75,713 |
| 40% | 40.1% | 61,204 | 61,340 |
| 30% | 30.4% | 45,903 | 46,466 |
| 20% | 19.9% | 30,602 | 30,458 |
| 10% | 10.2% | 15,301 | 15,619 |
| Active Idle | 0 | 0 | |

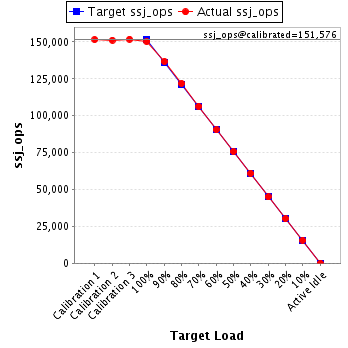
| Target Load | Actual Load | ssj_ops | |
|---|---|---|---|
| Target | Actual | ||
| Calibration 1 | 151,582 | ||
| Calibration 2 | 151,235 | ||
| Calibration 3 | 151,917 | ||
| ssj_ops@calibrated=151,576 | |||
| 100% | 99.2% | 151,576 | 150,358 |
| 90% | 90.2% | 136,418 | 136,784 |
| 80% | 80.5% | 121,261 | 121,976 |
| 70% | 70.2% | 106,103 | 106,385 |
| 60% | 59.7% | 90,946 | 90,516 |
| 50% | 50.0% | 75,788 | 75,802 |
| 40% | 40.2% | 60,630 | 60,996 |
| 30% | 29.7% | 45,473 | 44,954 |
| 20% | 19.9% | 30,315 | 30,208 |
| 10% | 10.4% | 15,158 | 15,691 |
| Active Idle | 0 | 0 | |
| Target Load | Actual Load | ssj_ops | |
|---|---|---|---|
| Target | Actual | ||
| Calibration 1 | 148,729 | ||
| Calibration 2 | 149,094 | ||
| Calibration 3 | 149,794 | ||
| ssj_ops@calibrated=149,444 | |||
| 100% | 99.3% | 149,444 | 148,401 |
| 90% | 90.0% | 134,500 | 134,434 |
| 80% | 79.1% | 119,555 | 118,259 |
| 70% | 70.4% | 104,611 | 105,276 |
| 60% | 60.5% | 89,666 | 90,433 |
| 50% | 50.4% | 74,722 | 75,366 |
| 40% | 40.1% | 59,778 | 59,966 |
| 30% | 29.8% | 44,833 | 44,573 |
| 20% | 20.2% | 29,889 | 30,155 |
| 10% | 9.8% | 14,944 | 14,705 |
| Active Idle | 0 | 0 | |

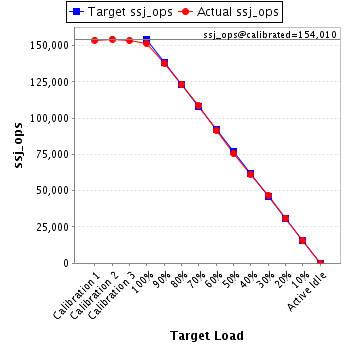
| Target Load | Actual Load | ssj_ops | |
|---|---|---|---|
| Target | Actual | ||
| Calibration 1 | 153,685 | ||
| Calibration 2 | 154,421 | ||
| Calibration 3 | 153,599 | ||
| ssj_ops@calibrated=154,010 | |||
| 100% | 98.3% | 154,010 | 151,386 |
| 90% | 89.6% | 138,609 | 137,996 |
| 80% | 79.9% | 123,208 | 123,052 |
| 70% | 70.5% | 107,807 | 108,537 |
| 60% | 59.5% | 92,406 | 91,630 |
| 50% | 49.3% | 77,005 | 75,876 |
| 40% | 39.8% | 61,604 | 61,342 |
| 30% | 30.5% | 46,203 | 46,900 |
| 20% | 20.1% | 30,802 | 30,927 |
| 10% | 10.1% | 15,401 | 15,567 |
| Active Idle | 0 | 0 | |