
SPECpower_ssj2008
Host 'M610-4' Performance Report
Copyright © 2007-2010 Standard Performance Evaluation Corporation
| Dell Inc. PowerEdge M610 | ssj_ops@100% = 896,317 ssj_ops@100% per JVM = 149,386 |
||||
| Test Sponsor: | Dell Inc. | SPEC License #: | 55 | Test Method: | Multi Node |
| Tested By: | Dell Inc. | Test Location: | Round Rock, TX, USA | Test Date: | Aug 12, 2010 |
| Hardware Availability: | Sep-2010 | Software Availability: | Jul-2009 | Publication: | Sep 9, 2010 |
| System Source: | Single Supplier | System Designation: | Server | Power Provisioning: | Line-powered |
| Target Load | Actual Load | ssj_ops | |
|---|---|---|---|
| Target | Actual | ||
| Calibration 1 | 900,270 | ||
| Calibration 2 | 901,912 | ||
| Calibration 3 | 899,408 | ||
| ssj_ops@calibrated=900,660 | |||
| 100% | 99.5% | 900,660 | 896,317 |
| 90% | 89.7% | 810,594 | 808,163 |
| 80% | 80.2% | 720,528 | 722,140 |
| 70% | 70.3% | 630,462 | 633,065 |
| 60% | 59.9% | 540,396 | 539,328 |
| 50% | 50.2% | 450,330 | 452,196 |
| 40% | 40.1% | 360,264 | 361,524 |
| 30% | 29.9% | 270,198 | 269,482 |
| 20% | 19.9% | 180,132 | 179,237 |
| 10% | 10.0% | 90,066 | 90,222 |
| Active Idle | 0 | 0 | |

| Set Identifier: | sut |
| Set Description: | PowerEdge M610 |
| # of Identical Nodes: | 16 |
| Comment: | None |
| Hardware | |
|---|---|
| Hardware Vendor: | Dell Inc. |
| Model: | PowerEdge M610 |
| Form Factor: | Blade |
| CPU Name: | Intel Xeon X5670 |
| CPU Characteristics: | Six Core, 2.93 GHz, 12 MB L3 Cache |
| CPU Frequency (MHz): | 2933 |
| CPU(s) Enabled: | 12 cores, 2 chips, 6 cores/chip |
| Hardware Threads: | 24 (2 / core) |
| CPU(s) Orderable: | 1,2 chip |
| Primary Cache: | 32 KB I + 32 KB D on chip per core |
| Secondary Cache: | 256 KB I+D on chip per core |
| Tertiary Cache: | 12 MB I+D on chip per chip |
| Other Cache: | None |
| Memory Amount (GB): | 12 |
| # and size of DIMM: | 6 x 2048 MB |
| Memory Details: | 2GB 2Rx8 PC3L-10600E ECC, Slots A1-A3, B1-B3 populated |
| Power Supply Quantity and Rating (W): | None |
| Power Supply Details: | Shared |
| Disk Drive: | 1 x 50GB 2.5" SSD SATA (Dell PN Y949P) |
| Disk Controller: | Modular SATA Pass-Through |
| # and type of Network Interface Cards (NICs) Installed: | 1 x onboard dual-port Gigabit Ethernet |
| NICs Enabled in Firmware / OS / Connected: | 2/1/1 |
| Network Speed (Mbit): | 1000 |
| Keyboard: | None |
| Mouse: | None |
| Monitor: | None |
| Optical Drives: | No |
| Other Hardware: | None |
| Software | |
|---|---|
| Power Management: | Power Saver Mode in OS (See Notes) |
| Operating System (OS): | Windows 2008 Server Enterprise x64 Edition |
| OS Version: | R2 |
| Filesystem: | NTFS |
| JVM Vendor: | IBM Corporation |
| JVM Version: | IBM J9 VM (build 2.4, J2RE 1.6.0 IBM J9 2.4 Windows Server 2008 amd64-64 jvmwa64 60sr5-20090519_35743 (JIT enabled, AOT enabled) |
| JVM Command-line Options: | -Xmn1100m -Xms1500m -Xmx1500m -Xaggressive -Xcompressedrefs -Xgcpolicy:gencon -XlockReservation -Xnoloa -XtlhPrefetch -Xlp |
| JVM Affinity: | start /affinity [F,F0,F00,F000,F0000,F00000] |
| JVM Instances: | 6 |
| JVM Initial Heap (MB): | 1500 |
| JVM Maximum Heap (MB): | 1500 |
| JVM Address Bits: | 64 |
| Boot Firmware Version: | 2.1.9 |
| Management Firmware Version: | iDRAC 3.0.0 A02 / CMC 3.0.1 A00 |
| Workload Version: | SSJ 1.2.6 |
| Director Location: | Controller |
| Other Software: | None |
| JVM Instance | ssj_ops@100% |
|---|---|
| M610-4.001 | 148,821 |
| M610-4.002 | 150,634 |
| M610-4.003 | 151,913 |
| M610-4.004 | 150,922 |
| M610-4.005 | 147,273 |
| M610-4.006 | 146,755 |
| ssj_ops@100% | 896,317 |
| ssj_ops@100% per JVM | 149,386 |
| Target Load | Actual Load | ssj_ops | |
|---|---|---|---|
| Target | Actual | ||
| Calibration 1 | 148,997 | ||
| Calibration 2 | 149,719 | ||
| Calibration 3 | 149,038 | ||
| ssj_ops@calibrated=149,379 | |||
| 100% | 99.6% | 149,379 | 148,821 |
| 90% | 89.4% | 134,441 | 133,561 |
| 80% | 80.9% | 119,503 | 120,864 |
| 70% | 70.4% | 104,565 | 105,106 |
| 60% | 60.2% | 89,627 | 89,918 |
| 50% | 50.4% | 74,689 | 75,340 |
| 40% | 40.3% | 59,751 | 60,146 |
| 30% | 29.8% | 44,814 | 44,577 |
| 20% | 20.0% | 29,876 | 29,879 |
| 10% | 9.7% | 14,938 | 14,459 |
| Active Idle | 0 | 0 | |
| Target Load | Actual Load | ssj_ops | |
|---|---|---|---|
| Target | Actual | ||
| Calibration 1 | 151,389 | ||
| Calibration 2 | 151,611 | ||
| Calibration 3 | 150,535 | ||
| ssj_ops@calibrated=151,073 | |||
| 100% | 99.7% | 151,073 | 150,634 |
| 90% | 89.5% | 135,966 | 135,135 |
| 80% | 80.5% | 120,858 | 121,600 |
| 70% | 70.2% | 105,751 | 106,117 |
| 60% | 59.7% | 90,644 | 90,126 |
| 50% | 50.4% | 75,536 | 76,190 |
| 40% | 40.4% | 60,429 | 60,982 |
| 30% | 30.2% | 45,322 | 45,662 |
| 20% | 19.5% | 30,215 | 29,493 |
| 10% | 10.1% | 15,107 | 15,300 |
| Active Idle | 0 | 0 | |
| Target Load | Actual Load | ssj_ops | |
|---|---|---|---|
| Target | Actual | ||
| Calibration 1 | 151,552 | ||
| Calibration 2 | 152,348 | ||
| Calibration 3 | 152,050 | ||
| ssj_ops@calibrated=152,199 | |||
| 100% | 99.8% | 152,199 | 151,913 |
| 90% | 90.5% | 136,979 | 137,732 |
| 80% | 79.4% | 121,759 | 120,906 |
| 70% | 70.3% | 106,539 | 106,999 |
| 60% | 60.3% | 91,319 | 91,760 |
| 50% | 50.3% | 76,099 | 76,612 |
| 40% | 40.4% | 60,880 | 61,435 |
| 30% | 30.1% | 45,660 | 45,795 |
| 20% | 19.7% | 30,440 | 30,001 |
| 10% | 10.3% | 15,220 | 15,658 |
| Active Idle | 0 | 0 | |
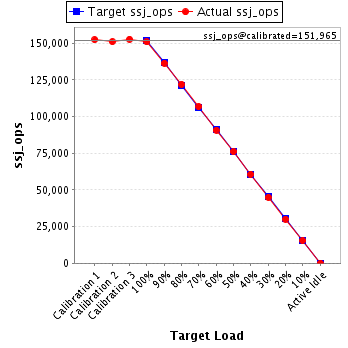
| Target Load | Actual Load | ssj_ops | |
|---|---|---|---|
| Target | Actual | ||
| Calibration 1 | 152,425 | ||
| Calibration 2 | 151,090 | ||
| Calibration 3 | 152,839 | ||
| ssj_ops@calibrated=151,965 | |||
| 100% | 99.3% | 151,965 | 150,922 |
| 90% | 89.8% | 136,768 | 136,452 |
| 80% | 80.3% | 121,572 | 122,088 |
| 70% | 70.4% | 106,375 | 106,923 |
| 60% | 59.7% | 91,179 | 90,787 |
| 50% | 50.2% | 75,982 | 76,237 |
| 40% | 39.9% | 60,786 | 60,706 |
| 30% | 29.6% | 45,589 | 44,947 |
| 20% | 19.8% | 30,393 | 30,144 |
| 10% | 10.2% | 15,196 | 15,517 |
| Active Idle | 0 | 0 | |
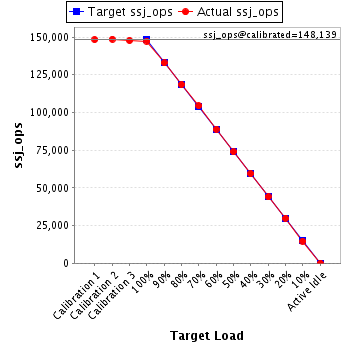
| Target Load | Actual Load | ssj_ops | |
|---|---|---|---|
| Target | Actual | ||
| Calibration 1 | 148,314 | ||
| Calibration 2 | 148,596 | ||
| Calibration 3 | 147,682 | ||
| ssj_ops@calibrated=148,139 | |||
| 100% | 99.4% | 148,139 | 147,273 |
| 90% | 89.7% | 133,325 | 132,832 |
| 80% | 80.0% | 118,511 | 118,470 |
| 70% | 70.5% | 103,697 | 104,385 |
| 60% | 60.0% | 88,883 | 88,956 |
| 50% | 49.9% | 74,070 | 73,856 |
| 40% | 40.1% | 59,256 | 59,375 |
| 30% | 29.7% | 44,442 | 44,041 |
| 20% | 20.2% | 29,628 | 29,894 |
| 10% | 9.9% | 14,814 | 14,714 |
| Active Idle | 0 | 0 | |
| Target Load | Actual Load | ssj_ops | |
|---|---|---|---|
| Target | Actual | ||
| Calibration 1 | 147,593 | ||
| Calibration 2 | 148,548 | ||
| Calibration 3 | 147,263 | ||
| ssj_ops@calibrated=147,906 | |||
| 100% | 99.2% | 147,906 | 146,755 |
| 90% | 89.6% | 133,115 | 132,450 |
| 80% | 79.9% | 118,325 | 118,213 |
| 70% | 70.0% | 103,534 | 103,535 |
| 60% | 59.3% | 88,743 | 87,782 |
| 50% | 50.0% | 73,953 | 73,961 |
| 40% | 39.8% | 59,162 | 58,879 |
| 30% | 30.1% | 44,372 | 44,459 |
| 20% | 20.2% | 29,581 | 29,827 |
| 10% | 9.9% | 14,791 | 14,574 |
| Active Idle | 0 | 0 | |
