
SPECpower_ssj2008
Host 'M610-6' Performance Report
Copyright © 2007-2010 Standard Performance Evaluation Corporation
| Dell Inc. PowerEdge M610 | ssj_ops@100% = 899,691 ssj_ops@100% per JVM = 149,948 |
||||
| Test Sponsor: | Dell Inc. | SPEC License #: | 55 | Test Method: | Multi Node |
| Tested By: | Dell Inc. | Test Location: | Round Rock, TX, USA | Test Date: | Aug 12, 2010 |
| Hardware Availability: | Sep-2010 | Software Availability: | Jul-2009 | Publication: | Sep 9, 2010 |
| System Source: | Single Supplier | System Designation: | Server | Power Provisioning: | Line-powered |
| Target Load | Actual Load | ssj_ops | |
|---|---|---|---|
| Target | Actual | ||
| Calibration 1 | 900,985 | ||
| Calibration 2 | 903,308 | ||
| Calibration 3 | 905,207 | ||
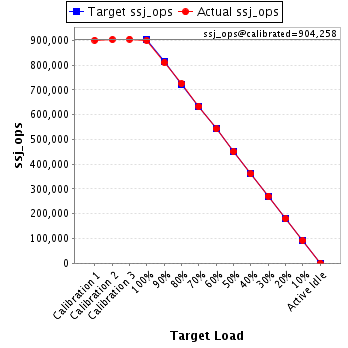
| ssj_ops@calibrated=904,258 | |||
| 100% | 99.5% | 904,258 | 899,691 |
| 90% | 89.7% | 813,832 | 810,942 |
| 80% | 80.3% | 723,406 | 725,772 |
| 70% | 70.0% | 632,980 | 633,015 |
| 60% | 60.0% | 542,555 | 542,835 |
| 50% | 49.8% | 452,129 | 450,400 |
| 40% | 39.9% | 361,703 | 360,625 |
| 30% | 30.0% | 271,277 | 271,382 |
| 20% | 19.9% | 180,852 | 179,751 |
| 10% | 10.1% | 90,426 | 91,705 |
| Active Idle | 0 | 0 | |
| Set Identifier: | sut |
| Set Description: | PowerEdge M610 |
| # of Identical Nodes: | 16 |
| Comment: | None |
| Hardware | |
|---|---|
| Hardware Vendor: | Dell Inc. |
| Model: | PowerEdge M610 |
| Form Factor: | Blade |
| CPU Name: | Intel Xeon X5670 |
| CPU Characteristics: | Six Core, 2.93 GHz, 12 MB L3 Cache |
| CPU Frequency (MHz): | 2933 |
| CPU(s) Enabled: | 12 cores, 2 chips, 6 cores/chip |
| Hardware Threads: | 24 (2 / core) |
| CPU(s) Orderable: | 1,2 chip |
| Primary Cache: | 32 KB I + 32 KB D on chip per core |
| Secondary Cache: | 256 KB I+D on chip per core |
| Tertiary Cache: | 12 MB I+D on chip per chip |
| Other Cache: | None |
| Memory Amount (GB): | 12 |
| # and size of DIMM: | 6 x 2048 MB |
| Memory Details: | 2GB 2Rx8 PC3L-10600E ECC, Slots A1-A3, B1-B3 populated |
| Power Supply Quantity and Rating (W): | None |
| Power Supply Details: | Shared |
| Disk Drive: | 1 x 50GB 2.5" SSD SATA (Dell PN Y949P) |
| Disk Controller: | Modular SATA Pass-Through |
| # and type of Network Interface Cards (NICs) Installed: | 1 x onboard dual-port Gigabit Ethernet |
| NICs Enabled in Firmware / OS / Connected: | 2/1/1 |
| Network Speed (Mbit): | 1000 |
| Keyboard: | None |
| Mouse: | None |
| Monitor: | None |
| Optical Drives: | No |
| Other Hardware: | None |
| Software | |
|---|---|
| Power Management: | Power Saver Mode in OS (See Notes) |
| Operating System (OS): | Windows 2008 Server Enterprise x64 Edition |
| OS Version: | R2 |
| Filesystem: | NTFS |
| JVM Vendor: | IBM Corporation |
| JVM Version: | IBM J9 VM (build 2.4, J2RE 1.6.0 IBM J9 2.4 Windows Server 2008 amd64-64 jvmwa64 60sr5-20090519_35743 (JIT enabled, AOT enabled) |
| JVM Command-line Options: | -Xmn1100m -Xms1500m -Xmx1500m -Xaggressive -Xcompressedrefs -Xgcpolicy:gencon -XlockReservation -Xnoloa -XtlhPrefetch -Xlp |
| JVM Affinity: | start /affinity [F,F0,F00,F000,F0000,F00000] |
| JVM Instances: | 6 |
| JVM Initial Heap (MB): | 1500 |
| JVM Maximum Heap (MB): | 1500 |
| JVM Address Bits: | 64 |
| Boot Firmware Version: | 2.1.9 |
| Management Firmware Version: | iDRAC 3.0.0 A02 / CMC 3.0.1 A00 |
| Workload Version: | SSJ 1.2.6 |
| Director Location: | Controller |
| Other Software: | None |
| JVM Instance | ssj_ops@100% |
|---|---|
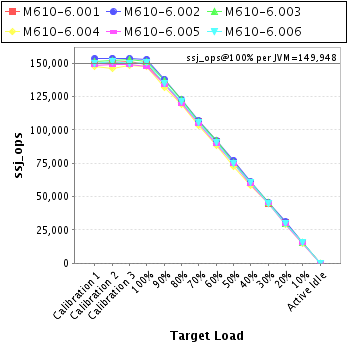
| M610-6.001 | 149,391 |
| M610-6.002 | 153,028 |
| M610-6.003 | 151,686 |
| M610-6.004 | 147,583 |
| M610-6.005 | 147,400 |
| M610-6.006 | 150,604 |
| ssj_ops@100% | 899,691 |
| ssj_ops@100% per JVM | 149,948 |
| Target Load | Actual Load | ssj_ops | |
|---|---|---|---|
| Target | Actual | ||
| Calibration 1 | 149,951 | ||
| Calibration 2 | 150,804 | ||
| Calibration 3 | 151,667 | ||
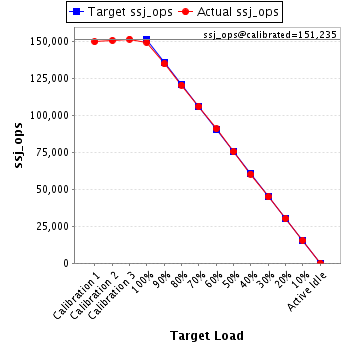
| ssj_ops@calibrated=151,235 | |||
| 100% | 98.8% | 151,235 | 149,391 |
| 90% | 89.2% | 136,112 | 134,968 |
| 80% | 79.7% | 120,988 | 120,597 |
| 70% | 70.1% | 105,865 | 106,057 |
| 60% | 60.2% | 90,741 | 91,011 |
| 50% | 49.9% | 75,618 | 75,520 |
| 40% | 39.9% | 60,494 | 60,366 |
| 30% | 29.7% | 45,371 | 44,924 |
| 20% | 20.0% | 30,247 | 30,242 |
| 10% | 10.3% | 15,124 | 15,515 |
| Active Idle | 0 | 0 | |
| Target Load | Actual Load | ssj_ops | |
|---|---|---|---|
| Target | Actual | ||
| Calibration 1 | 153,617 | ||
| Calibration 2 | 153,809 | ||
| Calibration 3 | 153,662 | ||
| ssj_ops@calibrated=153,735 | |||
| 100% | 99.5% | 153,735 | 153,028 |
| 90% | 89.8% | 138,362 | 138,108 |
| 80% | 79.8% | 122,988 | 122,742 |
| 70% | 69.6% | 107,615 | 107,017 |
| 60% | 59.7% | 92,241 | 91,761 |
| 50% | 50.3% | 76,868 | 77,300 |
| 40% | 39.7% | 61,494 | 61,069 |
| 30% | 29.9% | 46,121 | 45,894 |
| 20% | 20.2% | 30,747 | 31,087 |
| 10% | 10.1% | 15,374 | 15,510 |
| Active Idle | 0 | 0 | |

| Target Load | Actual Load | ssj_ops | |
|---|---|---|---|
| Target | Actual | ||
| Calibration 1 | 150,974 | ||
| Calibration 2 | 152,220 | ||
| Calibration 3 | 152,782 | ||
| ssj_ops@calibrated=152,501 | |||
| 100% | 99.5% | 152,501 | 151,686 |
| 90% | 89.8% | 137,251 | 136,886 |
| 80% | 80.3% | 122,001 | 122,509 |
| 70% | 69.8% | 106,751 | 106,467 |
| 60% | 60.4% | 91,501 | 92,075 |
| 50% | 49.3% | 76,250 | 75,249 |
| 40% | 39.9% | 61,000 | 60,890 |
| 30% | 30.0% | 45,750 | 45,778 |
| 20% | 19.7% | 30,500 | 30,057 |
| 10% | 10.4% | 15,250 | 15,808 |
| Active Idle | 0 | 0 | |

| Target Load | Actual Load | ssj_ops | |
|---|---|---|---|
| Target | Actual | ||
| Calibration 1 | 147,804 | ||
| Calibration 2 | 146,407 | ||
| Calibration 3 | 148,524 | ||
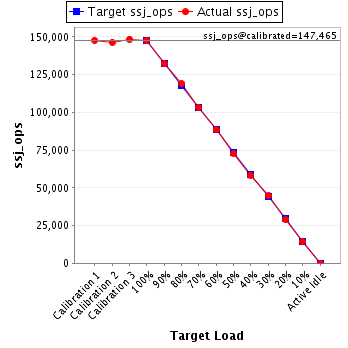
| ssj_ops@calibrated=147,465 | |||
| 100% | 100.1% | 147,465 | 147,583 |
| 90% | 89.6% | 132,719 | 132,124 |
| 80% | 80.6% | 117,972 | 118,880 |
| 70% | 70.0% | 103,226 | 103,196 |
| 60% | 59.9% | 88,479 | 88,387 |
| 50% | 49.4% | 73,733 | 72,892 |
| 40% | 39.5% | 58,986 | 58,291 |
| 30% | 30.4% | 44,240 | 44,769 |
| 20% | 19.6% | 29,493 | 28,923 |
| 10% | 9.9% | 14,747 | 14,546 |
| Active Idle | 0 | 0 | |
| Target Load | Actual Load | ssj_ops | |
|---|---|---|---|
| Target | Actual | ||
| Calibration 1 | 148,649 | ||
| Calibration 2 | 148,984 | ||
| Calibration 3 | 148,796 | ||
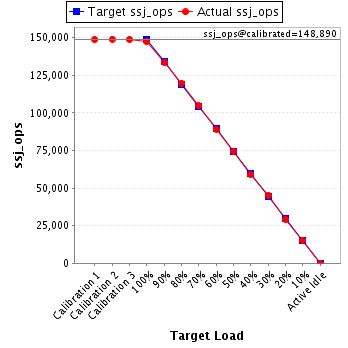
| ssj_ops@calibrated=148,890 | |||
| 100% | 99.0% | 148,890 | 147,400 |
| 90% | 89.8% | 134,001 | 133,743 |
| 80% | 80.4% | 119,112 | 119,643 |
| 70% | 70.4% | 104,223 | 104,799 |
| 60% | 59.9% | 89,334 | 89,166 |
| 50% | 50.0% | 74,445 | 74,514 |
| 40% | 39.7% | 59,556 | 59,097 |
| 30% | 30.3% | 44,667 | 45,093 |
| 20% | 19.7% | 29,778 | 29,380 |
| 10% | 10.1% | 14,889 | 15,055 |
| Active Idle | 0 | 0 | |
| Target Load | Actual Load | ssj_ops | |
|---|---|---|---|
| Target | Actual | ||
| Calibration 1 | 149,989 | ||
| Calibration 2 | 151,084 | ||
| Calibration 3 | 149,777 | ||
| ssj_ops@calibrated=150,431 | |||
| 100% | 100.1% | 150,431 | 150,604 |
| 90% | 89.8% | 135,388 | 135,113 |
| 80% | 80.7% | 120,344 | 121,402 |
| 70% | 70.1% | 105,301 | 105,480 |
| 60% | 60.1% | 90,258 | 90,434 |
| 50% | 49.8% | 75,215 | 74,925 |
| 40% | 40.5% | 60,172 | 60,912 |
| 30% | 29.9% | 45,129 | 44,924 |
| 20% | 20.0% | 30,086 | 30,062 |
| 10% | 10.2% | 15,043 | 15,271 |
| Active Idle | 0 | 0 | |
