SPECpower_ssj2008
Host 'M610-8' Performance Report
Copyright © 2007-2010 Standard Performance Evaluation Corporation
| Dell Inc. PowerEdge M610 | ssj_ops@100% = 901,737 ssj_ops@100% per JVM = 150,289 |
||||
| Test Sponsor: | Dell Inc. | SPEC License #: | 55 | Test Method: | Multi Node |
| Tested By: | Dell Inc. | Test Location: | Round Rock, TX, USA | Test Date: | Aug 12, 2010 |
| Hardware Availability: | Sep-2010 | Software Availability: | Jul-2009 | Publication: | Sep 9, 2010 |
| System Source: | Single Supplier | System Designation: | Server | Power Provisioning: | Line-powered |
| Target Load | Actual Load | ssj_ops | |
|---|---|---|---|
| Target | Actual | ||
| Calibration 1 | 903,141 | ||
| Calibration 2 | 906,628 | ||
| Calibration 3 | 904,192 | ||
| ssj_ops@calibrated=905,410 | |||
| 100% | 99.6% | 905,410 | 901,737 |
| 90% | 90.0% | 814,869 | 814,463 |
| 80% | 80.0% | 724,328 | 723,983 |
| 70% | 70.1% | 633,787 | 634,560 |
| 60% | 59.8% | 543,246 | 541,062 |
| 50% | 50.3% | 452,705 | 455,379 |
| 40% | 40.0% | 362,164 | 362,141 |
| 30% | 29.8% | 271,623 | 270,052 |
| 20% | 19.9% | 181,082 | 179,912 |
| 10% | 10.0% | 90,541 | 90,702 |
| Active Idle | 0 | 0 | |

| Set Identifier: | sut |
| Set Description: | PowerEdge M610 |
| # of Identical Nodes: | 16 |
| Comment: | None |
| Hardware | |
|---|---|
| Hardware Vendor: | Dell Inc. |
| Model: | PowerEdge M610 |
| Form Factor: | Blade |
| CPU Name: | Intel Xeon X5670 |
| CPU Characteristics: | Six Core, 2.93 GHz, 12 MB L3 Cache |
| CPU Frequency (MHz): | 2933 |
| CPU(s) Enabled: | 12 cores, 2 chips, 6 cores/chip |
| Hardware Threads: | 24 (2 / core) |
| CPU(s) Orderable: | 1,2 chip |
| Primary Cache: | 32 KB I + 32 KB D on chip per core |
| Secondary Cache: | 256 KB I+D on chip per core |
| Tertiary Cache: | 12 MB I+D on chip per chip |
| Other Cache: | None |
| Memory Amount (GB): | 12 |
| # and size of DIMM: | 6 x 2048 MB |
| Memory Details: | 2GB 2Rx8 PC3L-10600E ECC, Slots A1-A3, B1-B3 populated |
| Power Supply Quantity and Rating (W): | None |
| Power Supply Details: | Shared |
| Disk Drive: | 1 x 50GB 2.5" SSD SATA (Dell PN Y949P) |
| Disk Controller: | Modular SATA Pass-Through |
| # and type of Network Interface Cards (NICs) Installed: | 1 x onboard dual-port Gigabit Ethernet |
| NICs Enabled in Firmware / OS / Connected: | 2/1/1 |
| Network Speed (Mbit): | 1000 |
| Keyboard: | None |
| Mouse: | None |
| Monitor: | None |
| Optical Drives: | No |
| Other Hardware: | None |
| Software | |
|---|---|
| Power Management: | Power Saver Mode in OS (See Notes) |
| Operating System (OS): | Windows 2008 Server Enterprise x64 Edition |
| OS Version: | R2 |
| Filesystem: | NTFS |
| JVM Vendor: | IBM Corporation |
| JVM Version: | IBM J9 VM (build 2.4, J2RE 1.6.0 IBM J9 2.4 Windows Server 2008 amd64-64 jvmwa64 60sr5-20090519_35743 (JIT enabled, AOT enabled) |
| JVM Command-line Options: | -Xmn1100m -Xms1500m -Xmx1500m -Xaggressive -Xcompressedrefs -Xgcpolicy:gencon -XlockReservation -Xnoloa -XtlhPrefetch -Xlp |
| JVM Affinity: | start /affinity [F,F0,F00,F000,F0000,F00000] |
| JVM Instances: | 6 |
| JVM Initial Heap (MB): | 1500 |
| JVM Maximum Heap (MB): | 1500 |
| JVM Address Bits: | 64 |
| Boot Firmware Version: | 2.1.9 |
| Management Firmware Version: | iDRAC 3.0.0 A02 / CMC 3.0.1 A00 |
| Workload Version: | SSJ 1.2.6 |
| Director Location: | Controller |
| Other Software: | None |
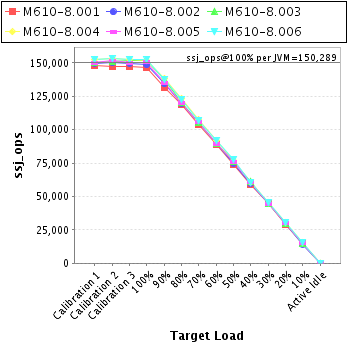
| JVM Instance | ssj_ops@100% |
|---|---|
| M610-8.001 | 146,873 |
| M610-8.002 | 148,450 |
| M610-8.003 | 151,497 |
| M610-8.004 | 151,625 |
| M610-8.005 | 150,549 |
| M610-8.006 | 152,742 |
| ssj_ops@100% | 901,737 |
| ssj_ops@100% per JVM | 150,289 |
| Target Load | Actual Load | ssj_ops | |
|---|---|---|---|
| Target | Actual | ||
| Calibration 1 | 148,211 | ||
| Calibration 2 | 147,521 | ||
| Calibration 3 | 147,395 | ||
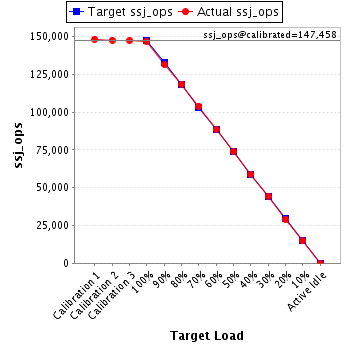
| ssj_ops@calibrated=147,458 | |||
| 100% | 99.6% | 147,458 | 146,873 |
| 90% | 89.2% | 132,712 | 131,547 |
| 80% | 80.4% | 117,966 | 118,530 |
| 70% | 70.5% | 103,221 | 103,942 |
| 60% | 60.1% | 88,475 | 88,614 |
| 50% | 50.1% | 73,729 | 73,922 |
| 40% | 40.0% | 58,983 | 58,923 |
| 30% | 30.2% | 44,237 | 44,478 |
| 20% | 19.8% | 29,492 | 29,196 |
| 10% | 10.0% | 14,746 | 14,758 |
| Active Idle | 0 | 0 | |
| Target Load | Actual Load | ssj_ops | |
|---|---|---|---|
| Target | Actual | ||
| Calibration 1 | 149,797 | ||
| Calibration 2 | 149,975 | ||
| Calibration 3 | 149,658 | ||
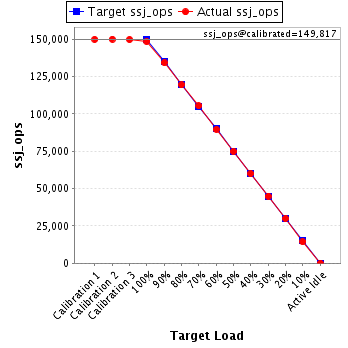
| ssj_ops@calibrated=149,817 | |||
| 100% | 99.1% | 149,817 | 148,450 |
| 90% | 89.6% | 134,835 | 134,217 |
| 80% | 79.6% | 119,853 | 119,321 |
| 70% | 70.3% | 104,872 | 105,368 |
| 60% | 59.8% | 89,890 | 89,564 |
| 50% | 50.1% | 74,908 | 74,986 |
| 40% | 40.0% | 59,927 | 59,899 |
| 30% | 30.0% | 44,945 | 44,959 |
| 20% | 20.0% | 29,963 | 29,925 |
| 10% | 9.6% | 14,982 | 14,407 |
| Active Idle | 0 | 0 | |
| Target Load | Actual Load | ssj_ops | |
|---|---|---|---|
| Target | Actual | ||
| Calibration 1 | 149,895 | ||
| Calibration 2 | 151,125 | ||
| Calibration 3 | 151,653 | ||
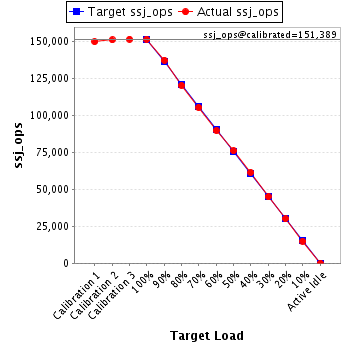
| ssj_ops@calibrated=151,389 | |||
| 100% | 100.1% | 151,389 | 151,497 |
| 90% | 90.8% | 136,250 | 137,428 |
| 80% | 79.5% | 121,111 | 120,294 |
| 70% | 69.6% | 105,972 | 105,437 |
| 60% | 59.3% | 90,833 | 89,743 |
| 50% | 50.3% | 75,694 | 76,083 |
| 40% | 40.6% | 60,555 | 61,502 |
| 30% | 29.7% | 45,417 | 45,013 |
| 20% | 19.9% | 30,278 | 30,067 |
| 10% | 9.9% | 15,139 | 14,962 |
| Active Idle | 0 | 0 | |
| Target Load | Actual Load | ssj_ops | |
|---|---|---|---|
| Target | Actual | ||
| Calibration 1 | 152,823 | ||
| Calibration 2 | 153,120 | ||
| Calibration 3 | 152,559 | ||
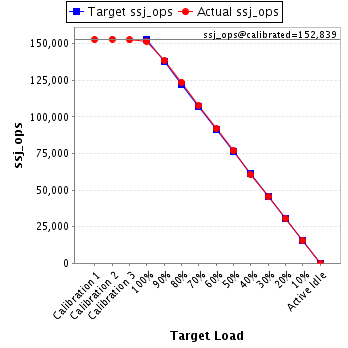
| ssj_ops@calibrated=152,839 | |||
| 100% | 99.2% | 152,839 | 151,625 |
| 90% | 90.6% | 137,555 | 138,436 |
| 80% | 80.9% | 122,271 | 123,595 |
| 70% | 70.4% | 106,987 | 107,634 |
| 60% | 60.2% | 91,703 | 92,007 |
| 50% | 50.2% | 76,420 | 76,735 |
| 40% | 39.7% | 61,136 | 60,630 |
| 30% | 29.7% | 45,852 | 45,401 |
| 20% | 19.8% | 30,568 | 30,336 |
| 10% | 10.2% | 15,284 | 15,646 |
| Active Idle | 0 | 0 | |
| Target Load | Actual Load | ssj_ops | |
|---|---|---|---|
| Target | Actual | ||
| Calibration 1 | 149,965 | ||
| Calibration 2 | 151,397 | ||
| Calibration 3 | 150,136 | ||
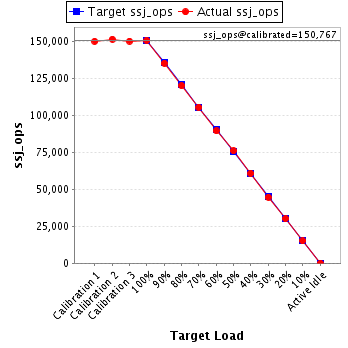
| ssj_ops@calibrated=150,767 | |||
| 100% | 99.9% | 150,767 | 150,549 |
| 90% | 89.6% | 135,690 | 135,098 |
| 80% | 79.5% | 120,613 | 119,905 |
| 70% | 69.9% | 105,537 | 105,411 |
| 60% | 59.3% | 90,460 | 89,400 |
| 50% | 50.4% | 75,383 | 75,963 |
| 40% | 40.3% | 60,307 | 60,794 |
| 30% | 29.6% | 45,230 | 44,676 |
| 20% | 19.9% | 30,153 | 30,067 |
| 10% | 10.0% | 15,077 | 15,133 |
| Active Idle | 0 | 0 | |
| Target Load | Actual Load | ssj_ops | |
|---|---|---|---|
| Target | Actual | ||
| Calibration 1 | 152,451 | ||
| Calibration 2 | 153,489 | ||
| Calibration 3 | 152,793 | ||
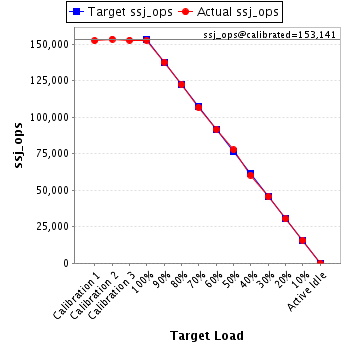
| ssj_ops@calibrated=153,141 | |||
| 100% | 99.7% | 153,141 | 152,742 |
| 90% | 89.9% | 137,827 | 137,737 |
| 80% | 79.9% | 122,513 | 122,338 |
| 70% | 69.7% | 107,199 | 106,769 |
| 60% | 59.9% | 91,885 | 91,734 |
| 50% | 50.7% | 76,571 | 77,690 |
| 40% | 39.4% | 61,256 | 60,392 |
| 30% | 29.7% | 45,942 | 45,525 |
| 20% | 19.8% | 30,628 | 30,322 |
| 10% | 10.3% | 15,314 | 15,796 |
| Active Idle | 0 | 0 | |