SPECpower_ssj2008
Host 'LUNAPARK2' Performance Report
Copyright © 2007-2010 Standard Performance Evaluation Corporation
| NEC Corporation Express5800/E120b-1 | ssj_ops@100% = 452,043 ssj_ops@100% per JVM = 56,505 |
||||
| Test Sponsor: | NEC Corporation | SPEC License #: | 9006 | Test Method: | Single Node |
| Tested By: | NEC Corporation | Test Location: | Fuchu, Tokyo, Japan | Test Date: | Sep 2, 2010 |
| Hardware Availability: | Sep-2010 | Software Availability: | Feb-2010 | Publication: | Sep 22, 2010 |
| System Source: | Single Supplier | System Designation: | Server | Power Provisioning: | Line-powered |
| Target Load | Actual Load | ssj_ops | |
|---|---|---|---|
| Target | Actual | ||
| Calibration 1 | 450,863 | ||
| Calibration 2 | 453,614 | ||
| Calibration 3 | 455,371 | ||
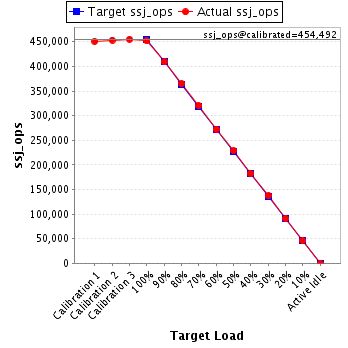
| ssj_ops@calibrated=454,492 | |||
| 100% | 99.5% | 454,492 | 452,043 |
| 90% | 90.0% | 409,043 | 409,069 |
| 80% | 80.2% | 363,594 | 364,445 |
| 70% | 70.3% | 318,145 | 319,707 |
| 60% | 60.0% | 272,695 | 272,609 |
| 50% | 50.2% | 227,246 | 228,365 |
| 40% | 40.1% | 181,797 | 182,269 |
| 30% | 30.1% | 136,348 | 136,931 |
| 20% | 19.9% | 90,898 | 90,532 |
| 10% | 10.0% | 45,449 | 45,667 |
| Active Idle | 0 | 0 | |
| Set Identifier: | sut |
| Set Description: | Express5800/E120b-1 (Intel Xeon L5630, 2.13 GHz) |
| # of Identical Nodes: | 1 |
| Comment: | None |
| Hardware | |
|---|---|
| Hardware Vendor: | NEC Corporation |
| Model: | Express5800/E120b-1 |
| Form Factor: | 1U |
| CPU Name: | Intel Xeon L5630 |
| CPU Characteristics: | Quad-Core, 2.13 GHz (Intel Turbo Boost Technology up to 2.40 GHz), 12 MB L3 Cache |
| CPU Frequency (MHz): | 2133 |
| CPU(s) Enabled: | 8 cores, 2 chips, 4 cores/chip |
| Hardware Threads: | 16 (2 / core) |
| CPU(s) Orderable: | 1,2 chips |
| Primary Cache: | 32 KB I + 32 KB D on chip per core |
| Secondary Cache: | 256 KB I+D on chip per core |
| Tertiary Cache: | 12 MB I+D on chip per chip |
| Other Cache: | None |
| Memory Amount (GB): | 16 |
| # and size of DIMM: | 4 x 4096 MB |
| Memory Details: | 4GB 2Rx8 PC3L-10600E ECC CL9; slots CPU1_DIMM1, CPU1_DIMM2, CPU2_DIMM1 and CPU2_DIMM2 populated |
| Power Supply Quantity and Rating (W): | 1 x 360 |
| Power Supply Details: | Delta TDPS-360AB E |
| Disk Drive: | 1 x 50GB SSD SATA, NEC P/N:N8150-702 |
| Disk Controller: | Integrated SATA controller |
| # and type of Network Interface Cards (NICs) Installed: | 2 x Intel 82574L Gigabit Ethernet Controller |
| NICs Enabled in Firmware / OS / Connected: | 1/1/1 |
| Network Speed (Mbit): | 1000 |
| Keyboard: | None |
| Mouse: | None |
| Monitor: | None |
| Optical Drives: | No |
| Other Hardware: | None |
| Software | |
|---|---|
| Power Management: | Power saver |
| Operating System (OS): | Microsoft Windows Server 2008 Enterprise x64 Edition |
| OS Version: | SP2 |
| Filesystem: | NTFS |
| JVM Vendor: | Oracle Corporation |
| JVM Version: | Oracle JRockit(R) 6 P28.0.0 (build P28.0.0-29_BR8175970_BR9402966-129478-1.6.0_11-20100223-1645-windows-x86_64) |
| JVM Command-line Options: | -Xms1810m -Xmx1810m -Xns1600m -XXaggressive -Xlargepages -Xgc:genpar -XXcallprofiling -XXgcthreads=2 -XXtlasize:min=4k,preferred=1024k |
| JVM Affinity: | start /affinity [3,C,30,C0,300,C00,3000,C000] |
| JVM Instances: | 8 |
| JVM Initial Heap (MB): | 1810 |
| JVM Maximum Heap (MB): | 1810 |
| JVM Address Bits: | 64 |
| Boot Firmware Version: | 1.0.0005 |
| Management Firmware Version: | 01.11 |
| Workload Version: | SSJ 1.2.6 |
| Director Location: | Controller |
| Other Software: | None |
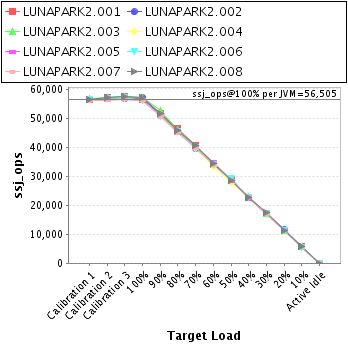
| JVM Instance | ssj_ops@100% |
|---|---|
| LUNAPARK2.001 | 56,479 |
| LUNAPARK2.002 | 57,131 |
| LUNAPARK2.003 | 57,241 |
| LUNAPARK2.004 | 56,019 |
| LUNAPARK2.005 | 56,134 |
| LUNAPARK2.006 | 56,012 |
| LUNAPARK2.007 | 56,025 |
| LUNAPARK2.008 | 57,001 |
| ssj_ops@100% | 452,043 |
| ssj_ops@100% per JVM | 56,505 |
| Target Load | Actual Load | ssj_ops | |
|---|---|---|---|
| Target | Actual | ||
| Calibration 1 | 56,381 | ||
| Calibration 2 | 57,023 | ||
| Calibration 3 | 57,519 | ||
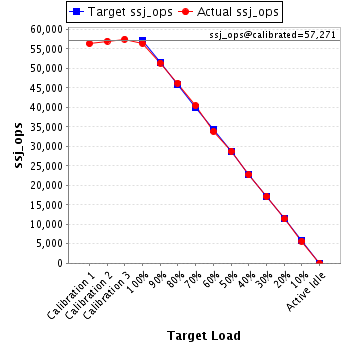
| ssj_ops@calibrated=57,271 | |||
| 100% | 98.6% | 57,271 | 56,479 |
| 90% | 89.7% | 51,544 | 51,394 |
| 80% | 80.8% | 45,817 | 46,251 |
| 70% | 70.6% | 40,090 | 40,450 |
| 60% | 59.1% | 34,363 | 33,850 |
| 50% | 50.2% | 28,636 | 28,754 |
| 40% | 39.7% | 22,909 | 22,711 |
| 30% | 29.9% | 17,181 | 17,141 |
| 20% | 19.8% | 11,454 | 11,366 |
| 10% | 9.9% | 5,727 | 5,675 |
| Active Idle | 0 | 0 | |
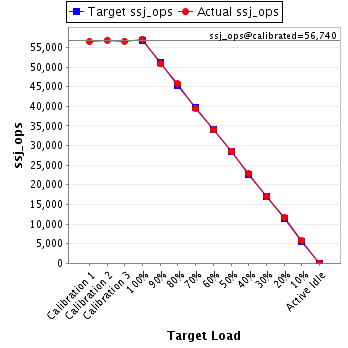
| Target Load | Actual Load | ssj_ops | |
|---|---|---|---|
| Target | Actual | ||
| Calibration 1 | 56,478 | ||
| Calibration 2 | 56,859 | ||
| Calibration 3 | 56,621 | ||
| ssj_ops@calibrated=56,740 | |||
| 100% | 100.7% | 56,740 | 57,131 |
| 90% | 89.6% | 51,066 | 50,840 |
| 80% | 80.7% | 45,392 | 45,777 |
| 70% | 69.5% | 39,718 | 39,450 |
| 60% | 59.9% | 34,044 | 33,976 |
| 50% | 50.1% | 28,370 | 28,430 |
| 40% | 40.2% | 22,696 | 22,787 |
| 30% | 30.1% | 17,022 | 17,064 |
| 20% | 20.5% | 11,348 | 11,629 |
| 10% | 10.2% | 5,674 | 5,796 |
| Active Idle | 0 | 0 | |
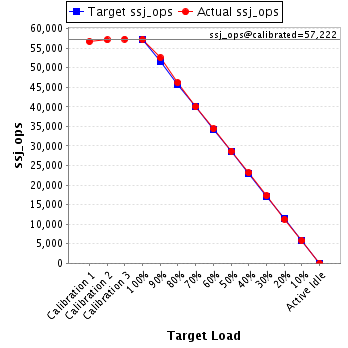
| Target Load | Actual Load | ssj_ops | |
|---|---|---|---|
| Target | Actual | ||
| Calibration 1 | 56,712 | ||
| Calibration 2 | 57,130 | ||
| Calibration 3 | 57,314 | ||
| ssj_ops@calibrated=57,222 | |||
| 100% | 100.0% | 57,222 | 57,241 |
| 90% | 91.9% | 51,500 | 52,564 |
| 80% | 80.7% | 45,778 | 46,177 |
| 70% | 70.0% | 40,055 | 40,057 |
| 60% | 60.1% | 34,333 | 34,370 |
| 50% | 50.1% | 28,611 | 28,663 |
| 40% | 40.4% | 22,889 | 23,129 |
| 30% | 30.2% | 17,167 | 17,257 |
| 20% | 19.7% | 11,444 | 11,263 |
| 10% | 10.1% | 5,722 | 5,801 |
| Active Idle | 0 | 0 | |
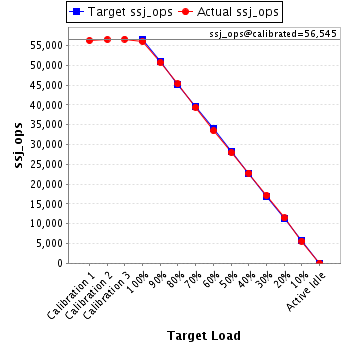
| Target Load | Actual Load | ssj_ops | |
|---|---|---|---|
| Target | Actual | ||
| Calibration 1 | 56,243 | ||
| Calibration 2 | 56,507 | ||
| Calibration 3 | 56,584 | ||
| ssj_ops@calibrated=56,545 | |||
| 100% | 99.1% | 56,545 | 56,019 |
| 90% | 89.7% | 50,891 | 50,705 |
| 80% | 80.1% | 45,236 | 45,289 |
| 70% | 69.6% | 39,582 | 39,380 |
| 60% | 59.2% | 33,927 | 33,471 |
| 50% | 49.4% | 28,273 | 27,927 |
| 40% | 40.3% | 22,618 | 22,774 |
| 30% | 30.3% | 16,964 | 17,141 |
| 20% | 20.2% | 11,309 | 11,439 |
| 10% | 9.9% | 5,655 | 5,602 |
| Active Idle | 0 | 0 | |
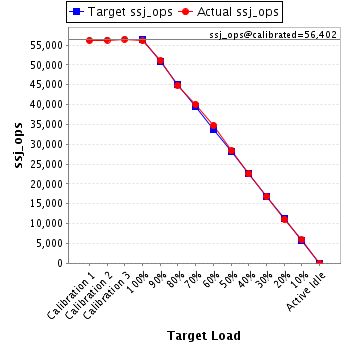
| Target Load | Actual Load | ssj_ops | |
|---|---|---|---|
| Target | Actual | ||
| Calibration 1 | 56,191 | ||
| Calibration 2 | 56,293 | ||
| Calibration 3 | 56,510 | ||
| ssj_ops@calibrated=56,402 | |||
| 100% | 99.5% | 56,402 | 56,134 |
| 90% | 90.5% | 50,762 | 51,043 |
| 80% | 79.6% | 45,121 | 44,877 |
| 70% | 71.0% | 39,481 | 40,066 |
| 60% | 61.5% | 33,841 | 34,713 |
| 50% | 50.3% | 28,201 | 28,345 |
| 40% | 40.0% | 22,561 | 22,584 |
| 30% | 29.9% | 16,921 | 16,878 |
| 20% | 19.7% | 11,280 | 11,116 |
| 10% | 10.4% | 5,640 | 5,875 |
| Active Idle | 0 | 0 | |
| Target Load | Actual Load | ssj_ops | |
|---|---|---|---|
| Target | Actual | ||
| Calibration 1 | 56,454 | ||
| Calibration 2 | 56,654 | ||
| Calibration 3 | 57,122 | ||
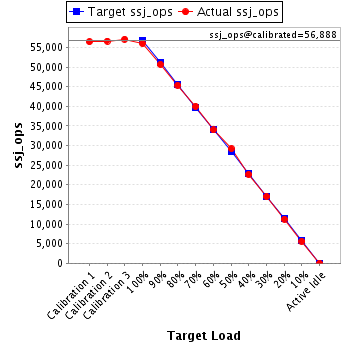
| ssj_ops@calibrated=56,888 | |||
| 100% | 98.5% | 56,888 | 56,012 |
| 90% | 89.1% | 51,199 | 50,684 |
| 80% | 79.7% | 45,510 | 45,362 |
| 70% | 70.4% | 39,822 | 40,021 |
| 60% | 59.7% | 34,133 | 33,981 |
| 50% | 51.4% | 28,444 | 29,219 |
| 40% | 39.8% | 22,755 | 22,662 |
| 30% | 29.9% | 17,066 | 17,012 |
| 20% | 19.8% | 11,378 | 11,260 |
| 10% | 9.8% | 5,689 | 5,596 |
| Active Idle | 0 | 0 | |
| Target Load | Actual Load | ssj_ops | |
|---|---|---|---|
| Target | Actual | ||
| Calibration 1 | 56,008 | ||
| Calibration 2 | 56,128 | ||
| Calibration 3 | 56,444 | ||
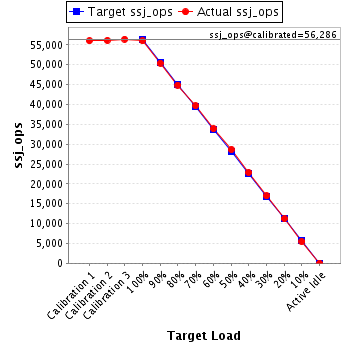
| ssj_ops@calibrated=56,286 | |||
| 100% | 99.5% | 56,286 | 56,025 |
| 90% | 89.6% | 50,658 | 50,414 |
| 80% | 79.8% | 45,029 | 44,889 |
| 70% | 70.4% | 39,400 | 39,637 |
| 60% | 60.2% | 33,772 | 33,874 |
| 50% | 50.9% | 28,143 | 28,645 |
| 40% | 40.6% | 22,514 | 22,872 |
| 30% | 30.1% | 16,886 | 16,947 |
| 20% | 19.9% | 11,257 | 11,216 |
| 10% | 9.7% | 5,629 | 5,471 |
| Active Idle | 0 | 0 | |
| Target Load | Actual Load | ssj_ops | |
|---|---|---|---|
| Target | Actual | ||
| Calibration 1 | 56,396 | ||
| Calibration 2 | 57,020 | ||
| Calibration 3 | 57,256 | ||
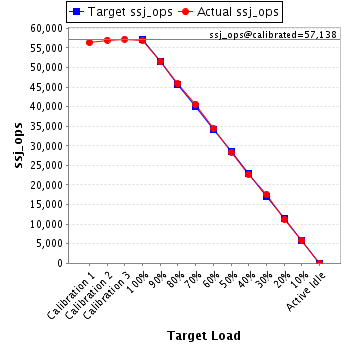
| ssj_ops@calibrated=57,138 | |||
| 100% | 99.8% | 57,138 | 57,001 |
| 90% | 90.0% | 51,424 | 51,426 |
| 80% | 80.2% | 45,710 | 45,823 |
| 70% | 71.1% | 39,997 | 40,647 |
| 60% | 60.2% | 34,283 | 34,372 |
| 50% | 49.7% | 28,569 | 28,383 |
| 40% | 39.8% | 22,855 | 22,751 |
| 30% | 30.6% | 17,141 | 17,491 |
| 20% | 19.7% | 11,428 | 11,242 |
| 10% | 10.2% | 5,714 | 5,852 |
| Active Idle | 0 | 0 | |