
SPECpower_ssj2008
Host 'Node-1-optimus' Performance Report
Copyright © 2007-2010 Standard Performance Evaluation Corporation
| Hewlett-Packard Company ProLiant DL170e G6 | ssj_ops@100% = 721,253 ssj_ops@100% per JVM = 120,209 |
||||
| Test Sponsor: | Hewlett-Packard Company | SPEC License #: | 3 | Test Method: | Multi Node |
| Tested By: | Hewlett-Packard Company | Test Location: | Houston, TX, USA | Test Date: | Nov 13, 2010 |
| Hardware Availability: | Nov-2010 | Software Availability: | Sep-2009 | Publication: | Dec 1, 2010 |
| System Source: | Single Supplier | System Designation: | Server | Power Provisioning: | Line-powered |
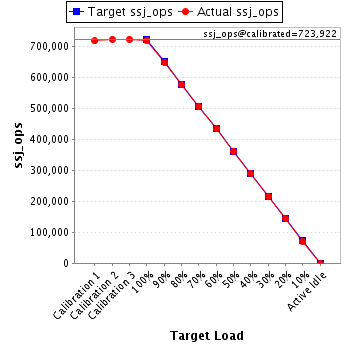
| Target Load | Actual Load | ssj_ops | |
|---|---|---|---|
| Target | Actual | ||
| Calibration 1 | 718,592 | ||
| Calibration 2 | 723,364 | ||
| Calibration 3 | 724,480 | ||
| ssj_ops@calibrated=723,922 | |||
| 100% | 99.6% | 723,922 | 721,253 |
| 90% | 89.7% | 651,530 | 649,625 |
| 80% | 79.7% | 579,137 | 576,938 |
| 70% | 69.9% | 506,745 | 506,202 |
| 60% | 60.1% | 434,353 | 435,383 |
| 50% | 49.9% | 361,961 | 361,548 |
| 40% | 40.1% | 289,569 | 290,545 |
| 30% | 29.9% | 217,177 | 216,643 |
| 20% | 19.9% | 144,784 | 144,319 |
| 10% | 9.9% | 72,392 | 71,680 |
| Active Idle | 0 | 0 | |
| Set Identifier: | sut |
| Set Description: | ProLiant DL170e G6 |
| # of Identical Nodes: | 4 |
| Comment: | None |
| Hardware | |
|---|---|
| Hardware Vendor: | Hewlett-Packard Company |
| Model: | ProLiant DL170e G6 |
| Form Factor: | 2U |
| CPU Name: | Intel Xeon L5640 |
| CPU Characteristics: | Six-Core, 2.27 GHz, 12 MB L3 Cache |
| CPU Frequency (MHz): | 2267 |
| CPU(s) Enabled: | 12 cores, 2 chips, 6 cores/chip |
| Hardware Threads: | 24 (2 / core) |
| CPU(s) Orderable: | 1,2 chips |
| Primary Cache: | 32 KB I + 32 KB D on chip per core |
| Secondary Cache: | 256 KB I+D on chip per core |
| Tertiary Cache: | 12 MB I+D on chip per chip |
| Other Cache: | None |
| Memory Amount (GB): | 16 |
| # and size of DIMM: | 4 x 4096 MB |
| Memory Details: | 4GB 2Rx8 PC3L-10600E ECC CL5; slots 1, 5, populated per proc |
| Power Supply Quantity and Rating (W): | None |
| Power Supply Details: | Shared |
| Disk Drive: | 1 x 120 GB SATA SSD, HP Part #539557-010 |
| Disk Controller: | Integrated SATA controller |
| # and type of Network Interface Cards (NICs) Installed: | 1 x HP NC362i Integrated Dual Port Gigabit Server Adapter |
| NICs Enabled in Firmware / OS / Connected: | 1/1/1 |
| Network Speed (Mbit): | 1000 |
| Keyboard: | None |
| Mouse: | None |
| Monitor: | None |
| Optical Drives: | No |
| Other Hardware: | None |
| Software | |
|---|---|
| Power Management: | Power saver enabled in OS |
| Operating System (OS): | Windows Server 2008, Enterprise Edition |
| OS Version: | R2 |
| Filesystem: | NTFS |
| JVM Vendor: | IBM Corporation |
| JVM Version: | IBM J9 VM (build 2.4, J2RE 1.6.0 IBM J9 2.4 Windows Server 2008 amd64-64 jvmwa660sr5-20090519_35743 (JIT enabled, AOT enabled) |
| JVM Command-line Options: | -Xaggressive -Xcompressedrefs -Xgcpolicy:gencon -Xmn1600m -Xms2000m -Xmx2000m -XlockReservation -Xnoloa -XtlhPrefetch -Xlp |
| JVM Affinity: | start /affinity [F,F0,F00,F000,F0000,F00000] |
| JVM Instances: | 6 |
| JVM Initial Heap (MB): | 2000 |
| JVM Maximum Heap (MB): | 2000 |
| JVM Address Bits: | 64 |
| Boot Firmware Version: | 034 10/25/10 |
| Management Firmware Version: | 4.21 7/16/10 |
| Workload Version: | SSJ 1.2.6 |
| Director Location: | Controller |
| Other Software: | IBM Websphere Application Server |
| JVM Instance | ssj_ops@100% |
|---|---|
| Node-1-optimus.001 | 121,159 |
| Node-1-optimus.002 | 119,600 |
| Node-1-optimus.003 | 120,122 |
| Node-1-optimus.004 | 120,048 |
| Node-1-optimus.005 | 121,416 |
| Node-1-optimus.006 | 118,908 |
| ssj_ops@100% | 721,253 |
| ssj_ops@100% per JVM | 120,209 |

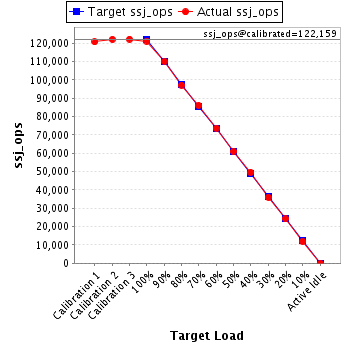
| Target Load | Actual Load | ssj_ops | |
|---|---|---|---|
| Target | Actual | ||
| Calibration 1 | 120,660 | ||
| Calibration 2 | 122,118 | ||
| Calibration 3 | 122,200 | ||
| ssj_ops@calibrated=122,159 | |||
| 100% | 99.2% | 122,159 | 121,159 |
| 90% | 90.1% | 109,943 | 110,079 |
| 80% | 79.6% | 97,727 | 97,192 |
| 70% | 70.4% | 85,511 | 86,006 |
| 60% | 60.3% | 73,296 | 73,688 |
| 50% | 50.0% | 61,080 | 61,036 |
| 40% | 40.6% | 48,864 | 49,646 |
| 30% | 29.5% | 36,648 | 36,063 |
| 20% | 19.8% | 24,432 | 24,197 |
| 10% | 9.8% | 12,216 | 12,008 |
| Active Idle | 0 | 0 | |
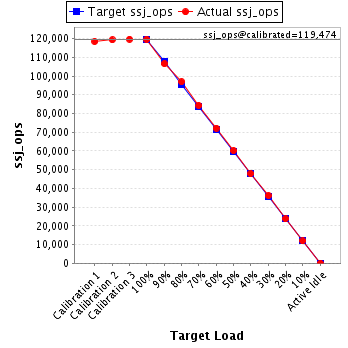
| Target Load | Actual Load | ssj_ops | |
|---|---|---|---|
| Target | Actual | ||
| Calibration 1 | 118,434 | ||
| Calibration 2 | 119,253 | ||
| Calibration 3 | 119,696 | ||
| ssj_ops@calibrated=119,474 | |||
| 100% | 100.1% | 119,474 | 119,600 |
| 90% | 89.2% | 107,527 | 106,564 |
| 80% | 81.1% | 95,579 | 96,889 |
| 70% | 70.6% | 83,632 | 84,331 |
| 60% | 60.4% | 71,685 | 72,199 |
| 50% | 50.4% | 59,737 | 60,167 |
| 40% | 40.0% | 47,790 | 47,780 |
| 30% | 30.2% | 35,842 | 36,119 |
| 20% | 19.8% | 23,895 | 23,676 |
| 10% | 10.0% | 11,947 | 11,895 |
| Active Idle | 0 | 0 | |
| Target Load | Actual Load | ssj_ops | |
|---|---|---|---|
| Target | Actual | ||
| Calibration 1 | 119,458 | ||
| Calibration 2 | 120,737 | ||
| Calibration 3 | 120,557 | ||
| ssj_ops@calibrated=120,647 | |||
| 100% | 99.6% | 120,647 | 120,122 |
| 90% | 89.2% | 108,582 | 107,643 |
| 80% | 78.9% | 96,518 | 95,224 |
| 70% | 69.1% | 84,453 | 83,332 |
| 60% | 59.7% | 72,388 | 71,994 |
| 50% | 50.3% | 60,323 | 60,692 |
| 40% | 40.0% | 48,259 | 48,316 |
| 30% | 29.8% | 36,194 | 35,902 |
| 20% | 20.2% | 24,129 | 24,388 |
| 10% | 9.8% | 12,065 | 11,829 |
| Active Idle | 0 | 0 | |

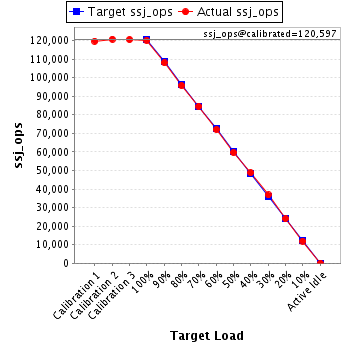
| Target Load | Actual Load | ssj_ops | |
|---|---|---|---|
| Target | Actual | ||
| Calibration 1 | 119,685 | ||
| Calibration 2 | 120,725 | ||
| Calibration 3 | 120,469 | ||
| ssj_ops@calibrated=120,597 | |||
| 100% | 99.5% | 120,597 | 120,048 |
| 90% | 89.6% | 108,537 | 108,009 |
| 80% | 79.4% | 96,478 | 95,704 |
| 70% | 70.1% | 84,418 | 84,507 |
| 60% | 59.7% | 72,358 | 72,033 |
| 50% | 49.5% | 60,299 | 59,666 |
| 40% | 40.5% | 48,239 | 48,786 |
| 30% | 30.5% | 36,179 | 36,781 |
| 20% | 19.9% | 24,119 | 23,949 |
| 10% | 9.9% | 12,060 | 11,974 |
| Active Idle | 0 | 0 | |
| Target Load | Actual Load | ssj_ops | |
|---|---|---|---|
| Target | Actual | ||
| Calibration 1 | 121,555 | ||
| Calibration 2 | 121,642 | ||
| Calibration 3 | 121,799 | ||
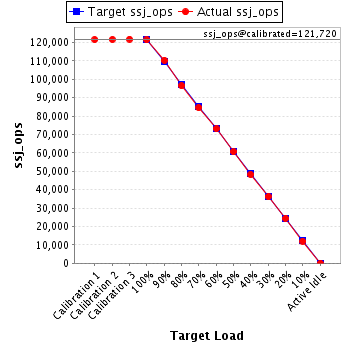
| ssj_ops@calibrated=121,720 | |||
| 100% | 99.8% | 121,720 | 121,416 |
| 90% | 90.6% | 109,548 | 110,308 |
| 80% | 79.2% | 97,376 | 96,403 |
| 70% | 69.5% | 85,204 | 84,546 |
| 60% | 60.0% | 73,032 | 73,088 |
| 50% | 49.8% | 60,860 | 60,584 |
| 40% | 39.6% | 48,688 | 48,182 |
| 30% | 29.8% | 36,516 | 36,218 |
| 20% | 20.1% | 24,344 | 24,460 |
| 10% | 9.9% | 12,172 | 12,041 |
| Active Idle | 0 | 0 | |
| Target Load | Actual Load | ssj_ops | |
|---|---|---|---|
| Target | Actual | ||
| Calibration 1 | 118,800 | ||
| Calibration 2 | 118,889 | ||
| Calibration 3 | 119,759 | ||
| ssj_ops@calibrated=119,324 | |||
| 100% | 99.7% | 119,324 | 118,908 |
| 90% | 89.7% | 107,391 | 107,021 |
| 80% | 80.1% | 95,459 | 95,526 |
| 70% | 70.0% | 83,527 | 83,481 |
| 60% | 60.7% | 71,594 | 72,381 |
| 50% | 49.8% | 59,662 | 59,403 |
| 40% | 40.1% | 47,730 | 47,835 |
| 30% | 29.8% | 35,797 | 35,560 |
| 20% | 19.8% | 23,865 | 23,649 |
| 10% | 10.0% | 11,932 | 11,933 |
| Active Idle | 0 | 0 | |
