
SPECpower_ssj2008
Host 'Node-4-optimus' Performance Report
Copyright © 2007-2010 Standard Performance Evaluation Corporation
| Hewlett-Packard Company ProLiant DL170e G6 | ssj_ops@100% = 718,704 ssj_ops@100% per JVM = 119,784 |
||||
| Test Sponsor: | Hewlett-Packard Company | SPEC License #: | 3 | Test Method: | Multi Node |
| Tested By: | Hewlett-Packard Company | Test Location: | Houston, TX, USA | Test Date: | Nov 13, 2010 |
| Hardware Availability: | Nov-2010 | Software Availability: | Sep-2009 | Publication: | Dec 1, 2010 |
| System Source: | Single Supplier | System Designation: | Server | Power Provisioning: | Line-powered |
| Target Load | Actual Load | ssj_ops | |
|---|---|---|---|
| Target | Actual | ||
| Calibration 1 | 715,665 | ||
| Calibration 2 | 721,647 | ||
| Calibration 3 | 721,767 | ||
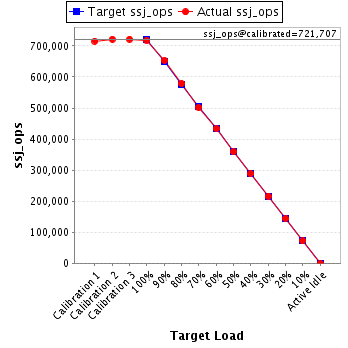
| ssj_ops@calibrated=721,707 | |||
| 100% | 99.6% | 721,707 | 718,704 |
| 90% | 90.5% | 649,537 | 653,281 |
| 80% | 80.2% | 577,366 | 578,871 |
| 70% | 69.5% | 505,195 | 501,554 |
| 60% | 60.1% | 433,024 | 433,537 |
| 50% | 49.7% | 360,854 | 358,612 |
| 40% | 40.0% | 288,683 | 288,690 |
| 30% | 30.0% | 216,512 | 216,194 |
| 20% | 20.0% | 144,341 | 144,036 |
| 10% | 9.9% | 72,171 | 71,801 |
| Active Idle | 0 | 0 | |
| Set Identifier: | sut |
| Set Description: | ProLiant DL170e G6 |
| # of Identical Nodes: | 4 |
| Comment: | None |
| Hardware | |
|---|---|
| Hardware Vendor: | Hewlett-Packard Company |
| Model: | ProLiant DL170e G6 |
| Form Factor: | 2U |
| CPU Name: | Intel Xeon L5640 |
| CPU Characteristics: | Six-Core, 2.27 GHz, 12 MB L3 Cache |
| CPU Frequency (MHz): | 2267 |
| CPU(s) Enabled: | 12 cores, 2 chips, 6 cores/chip |
| Hardware Threads: | 24 (2 / core) |
| CPU(s) Orderable: | 1,2 chips |
| Primary Cache: | 32 KB I + 32 KB D on chip per core |
| Secondary Cache: | 256 KB I+D on chip per core |
| Tertiary Cache: | 12 MB I+D on chip per chip |
| Other Cache: | None |
| Memory Amount (GB): | 16 |
| # and size of DIMM: | 4 x 4096 MB |
| Memory Details: | 4GB 2Rx8 PC3L-10600E ECC CL5; slots 1, 5, populated per proc |
| Power Supply Quantity and Rating (W): | None |
| Power Supply Details: | Shared |
| Disk Drive: | 1 x 120 GB SATA SSD, HP Part #539557-010 |
| Disk Controller: | Integrated SATA controller |
| # and type of Network Interface Cards (NICs) Installed: | 1 x HP NC362i Integrated Dual Port Gigabit Server Adapter |
| NICs Enabled in Firmware / OS / Connected: | 1/1/1 |
| Network Speed (Mbit): | 1000 |
| Keyboard: | None |
| Mouse: | None |
| Monitor: | None |
| Optical Drives: | No |
| Other Hardware: | None |
| Software | |
|---|---|
| Power Management: | Power saver enabled in OS |
| Operating System (OS): | Windows Server 2008, Enterprise Edition |
| OS Version: | R2 |
| Filesystem: | NTFS |
| JVM Vendor: | IBM Corporation |
| JVM Version: | IBM J9 VM (build 2.4, J2RE 1.6.0 IBM J9 2.4 Windows Server 2008 amd64-64 jvmwa660sr5-20090519_35743 (JIT enabled, AOT enabled) |
| JVM Command-line Options: | -Xaggressive -Xcompressedrefs -Xgcpolicy:gencon -Xmn1600m -Xms2000m -Xmx2000m -XlockReservation -Xnoloa -XtlhPrefetch -Xlp |
| JVM Affinity: | start /affinity [F,F0,F00,F000,F0000,F00000] |
| JVM Instances: | 6 |
| JVM Initial Heap (MB): | 2000 |
| JVM Maximum Heap (MB): | 2000 |
| JVM Address Bits: | 64 |
| Boot Firmware Version: | 034 10/25/10 |
| Management Firmware Version: | 4.21 7/16/10 |
| Workload Version: | SSJ 1.2.6 |
| Director Location: | Controller |
| Other Software: | IBM Websphere Application Server |
| JVM Instance | ssj_ops@100% |
|---|---|
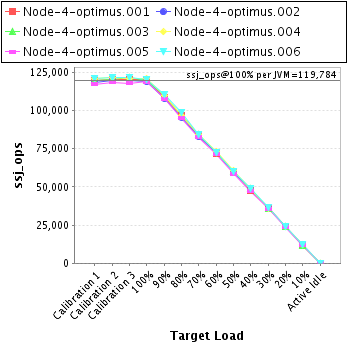
| Node-4-optimus.001 | 120,055 |
| Node-4-optimus.002 | 118,768 |
| Node-4-optimus.003 | 119,730 |
| Node-4-optimus.004 | 120,967 |
| Node-4-optimus.005 | 118,889 |
| Node-4-optimus.006 | 120,294 |
| ssj_ops@100% | 718,704 |
| ssj_ops@100% per JVM | 119,784 |
| Target Load | Actual Load | ssj_ops | |
|---|---|---|---|
| Target | Actual | ||
| Calibration 1 | 119,739 | ||
| Calibration 2 | 119,956 | ||
| Calibration 3 | 120,170 | ||
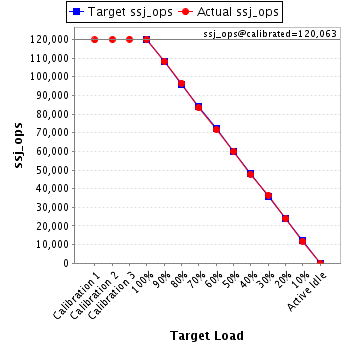
| ssj_ops@calibrated=120,063 | |||
| 100% | 100.0% | 120,063 | 120,055 |
| 90% | 90.2% | 108,057 | 108,275 |
| 80% | 80.4% | 96,050 | 96,574 |
| 70% | 69.4% | 84,044 | 83,366 |
| 60% | 59.7% | 72,038 | 71,669 |
| 50% | 49.9% | 60,031 | 59,964 |
| 40% | 39.8% | 48,025 | 47,800 |
| 30% | 30.4% | 36,019 | 36,462 |
| 20% | 19.8% | 24,013 | 23,820 |
| 10% | 9.9% | 12,006 | 11,884 |
| Active Idle | 0 | 0 | |
| Target Load | Actual Load | ssj_ops | |
|---|---|---|---|
| Target | Actual | ||
| Calibration 1 | 118,131 | ||
| Calibration 2 | 119,864 | ||
| Calibration 3 | 119,846 | ||
| ssj_ops@calibrated=119,855 | |||
| 100% | 99.1% | 119,855 | 118,768 |
| 90% | 89.9% | 107,869 | 107,743 |
| 80% | 79.7% | 95,884 | 95,540 |
| 70% | 69.2% | 83,898 | 82,885 |
| 60% | 60.3% | 71,913 | 72,315 |
| 50% | 49.7% | 59,927 | 59,589 |
| 40% | 40.0% | 47,942 | 47,994 |
| 30% | 29.8% | 35,956 | 35,697 |
| 20% | 20.1% | 23,971 | 24,042 |
| 10% | 10.2% | 11,985 | 12,204 |
| Active Idle | 0 | 0 | |

| Target Load | Actual Load | ssj_ops | |
|---|---|---|---|
| Target | Actual | ||
| Calibration 1 | 119,372 | ||
| Calibration 2 | 120,464 | ||
| Calibration 3 | 121,494 | ||
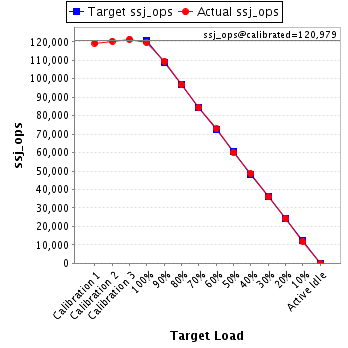
| ssj_ops@calibrated=120,979 | |||
| 100% | 99.0% | 120,979 | 119,730 |
| 90% | 90.5% | 108,881 | 109,472 |
| 80% | 80.1% | 96,783 | 96,850 |
| 70% | 69.8% | 84,685 | 84,458 |
| 60% | 60.2% | 72,587 | 72,796 |
| 50% | 49.7% | 60,490 | 60,174 |
| 40% | 40.2% | 48,392 | 48,630 |
| 30% | 29.7% | 36,294 | 35,972 |
| 20% | 20.0% | 24,196 | 24,153 |
| 10% | 9.9% | 12,098 | 11,948 |
| Active Idle | 0 | 0 | |
| Target Load | Actual Load | ssj_ops | |
|---|---|---|---|
| Target | Actual | ||
| Calibration 1 | 120,595 | ||
| Calibration 2 | 121,715 | ||
| Calibration 3 | 120,830 | ||
| ssj_ops@calibrated=121,273 | |||
| 100% | 99.7% | 121,273 | 120,967 |
| 90% | 90.7% | 109,145 | 109,999 |
| 80% | 79.6% | 97,018 | 96,503 |
| 70% | 69.5% | 84,891 | 84,290 |
| 60% | 60.1% | 72,764 | 72,939 |
| 50% | 49.8% | 60,636 | 60,404 |
| 40% | 39.7% | 48,509 | 48,156 |
| 30% | 29.7% | 36,382 | 36,023 |
| 20% | 20.0% | 24,255 | 24,242 |
| 10% | 9.9% | 12,127 | 11,974 |
| Active Idle | 0 | 0 | |

| Target Load | Actual Load | ssj_ops | |
|---|---|---|---|
| Target | Actual | ||
| Calibration 1 | 117,232 | ||
| Calibration 2 | 118,323 | ||
| Calibration 3 | 117,655 | ||
| ssj_ops@calibrated=117,989 | |||
| 100% | 100.8% | 117,989 | 118,889 |
| 90% | 91.2% | 106,190 | 107,658 |
| 80% | 80.5% | 94,391 | 94,989 |
| 70% | 69.9% | 82,592 | 82,518 |
| 60% | 60.5% | 70,794 | 71,368 |
| 50% | 49.7% | 58,995 | 58,640 |
| 40% | 40.1% | 47,196 | 47,257 |
| 30% | 30.2% | 35,397 | 35,585 |
| 20% | 20.0% | 23,598 | 23,621 |
| 10% | 10.0% | 11,799 | 11,808 |
| Active Idle | 0 | 0 | |

| Target Load | Actual Load | ssj_ops | |
|---|---|---|---|
| Target | Actual | ||
| Calibration 1 | 120,596 | ||
| Calibration 2 | 121,325 | ||
| Calibration 3 | 121,773 | ||
| ssj_ops@calibrated=121,549 | |||
| 100% | 99.0% | 121,549 | 120,294 |
| 90% | 90.6% | 109,394 | 110,134 |
| 80% | 81.0% | 97,239 | 98,414 |
| 70% | 69.1% | 85,084 | 84,037 |
| 60% | 59.6% | 72,929 | 72,449 |
| 50% | 49.2% | 60,774 | 59,841 |
| 40% | 40.2% | 48,619 | 48,854 |
| 30% | 30.0% | 36,465 | 36,454 |
| 20% | 19.9% | 24,310 | 24,158 |
| 10% | 9.9% | 12,155 | 11,983 |
| Active Idle | 0 | 0 | |
