SPECpower_ssj2008
Aggregate Performance Report
Copyright © 2007-2011 Standard Performance Evaluation Corporation
| SGI Rackable C2112-4TY14 | ssj_ops@100% = 2,891,044 ssj_ops@100% per Host = 722,761 ssj_ops@100% per JVM = 120,460 |
||||
| Test Sponsor: | SGI | SPEC License #: | 4 | Test Method: | Multi Node |
| Tested By: | SGI | Test Location: | Fremont, CA, USA | Test Date: | Jan 6, 2011 |
| Hardware Availability: | Feb-2011 | Software Availability: | Dec-2010 | Publication: | Jan 26, 2011 |
| System Source: | Single Supplier | System Designation: | Server | Power Provisioning: | Line-powered |
| Target Load | Actual Load | ssj_ops | |
|---|---|---|---|
| Target | Actual | ||
| Calibration 1 | 2,890,650 | ||
| Calibration 2 | 2,903,120 | ||
| Calibration 3 | 2,901,918 | ||
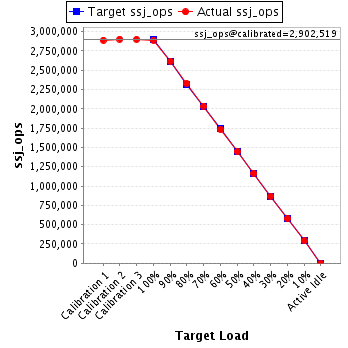
| ssj_ops@calibrated=2,902,519 | |||
| 100% | 99.6% | 2,902,519 | 2,891,044 |
| 90% | 90.2% | 2,612,267 | 2,617,220 |
| 80% | 80.2% | 2,322,015 | 2,329,179 |
| 70% | 70.2% | 2,031,763 | 2,037,153 |
| 60% | 59.9% | 1,741,511 | 1,737,271 |
| 50% | 49.9% | 1,451,260 | 1,447,887 |
| 40% | 40.1% | 1,161,008 | 1,162,805 |
| 30% | 30.0% | 870,756 | 870,820 |
| 20% | 19.9% | 580,504 | 577,665 |
| 10% | 10.0% | 290,252 | 290,898 |
| Active Idle | 0 | 0 | |
| # of Nodes | # of Chips | # of Cores | # of Threads | Total RAM (GB) | # of OS Images | # of JVM Instances |
|---|---|---|---|---|---|---|
| 4 | 8 | 48 | 96 | 64.0 | 4 | 24 |
| Set Identifier: | sut |
| Set Description: | Rackable C2112-4TY14 |
| # of Identical Nodes: | 4 |
| Comment: | None |
| Hardware per Node | |
|---|---|
| Hardware Vendor: | SGI |
| Model: | Rackable C2112-4TY14 |
| Form Factor: | Blade |
| CPU Name: | Intel Xeon L5640 |
| CPU Characteristics: | Six-Core, 2.27 GHz, 12 MB L3 Cache |
| CPU Frequency (MHz): | 2267 |
| CPU(s) Enabled: | 12 cores, 2 chips, 6 cores/chip |
| Hardware Threads: | 24 (2 / core) |
| CPU(s) Orderable: | 1,2 chips |
| Primary Cache: | 32 KB I + 32 KB D on chip per core |
| Secondary Cache: | 256 KB I+D on chip per core |
| Tertiary Cache: | 12 MB I+D on chip per chip |
| Other Cache: | None |
| Memory Amount (GB): | 16 |
| # and size of DIMM: | 4 x 4096 MB |
| Memory Details: | 4GB 2Rx8 PC3L-10600R; slots 1A and 2A populated for each processor |
| Power Supply Quantity and Rating (W): | None |
| Power Supply Details: | Shared |
| Disk Drive: | 1 x 60 GB SATA SSD, SGI Part #SGICSTE025M31-0060 |
| Disk Controller: | Intel ESB2 based Integrated SATA controller |
| # and type of Network Interface Cards (NICs) Installed: | 2 x Integrated Intel 82574L Gigabit Ethernet |
| NICs Enabled in Firmware / OS / Connected: | 2/2/1 |
| Network Speed (Mbit): | 1000 |
| Keyboard: | None |
| Mouse: | None |
| Monitor: | None |
| Optical Drives: | No |
| Other Hardware: | None |
| Software per Node | |
|---|---|
| Power Management: | power saver enabled in OS |
| Operating System (OS): | Microsoft Windows Server 2008 R2 Enterprise Edition |
| OS Version: | 64bit |
| Filesystem: | NTFS |
| JVM Vendor: | IBM Corporation |
| JVM Version: | IBM J9 VM (build 2.4, JRE 1.6.0 IBM J9 2.4 Windows Server 2008 amd64-64 jvmwa6460sr7-20091214_49398 (JIT enabled, AOT enabled) |
| JVM Command-line Options: | -Xmn1600m -Xms2000m -Xmx2000m -Xaggressive -Xcompressedrefs -Xgcpolicy:gencon -XlockReservation -Xnoloa -XtlhPrefetch -Xlp |
| JVM Affinity: | start /AFFINITY [F F0 F00 F000 F0000 F00000] |
| JVM Instances: | 6 |
| JVM Initial Heap (MB): | 2000 |
| JVM Maximum Heap (MB): | 2000 |
| JVM Address Bits: | 64 |
| Boot Firmware Version: | 2.0c.b01 |
| Management Firmware Version: | None |
| Workload Version: | SSJ 1.2.6 |
| Director Location: | Controller |
| Other Software: | IBM Websphere Application Server Community Edition V2.1.1.4 for windows on X86-64bit |
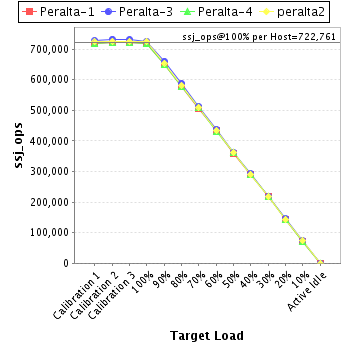
| Host | ssj_ops@100% |
|---|---|
| Peralta-1 | 719,046 |
| Peralta-3 | 726,290 |
| Peralta-4 | 719,832 |
| peralta2 | 725,877 |
| ssj_ops@100% | 2,891,044 |
| ssj_ops@100% per Host | 722,761 |
| ssj_ops@100% per JVM | 120,460 |
| Target Load | Actual Load | ssj_ops | |
|---|---|---|---|
| Target | Actual | ||
| Calibration 1 | 719,647 | ||
| Calibration 2 | 722,318 | ||
| Calibration 3 | 722,513 | ||
| ssj_ops@calibrated=722,415 | |||
| 100% | 99.5% | 722,415 | 719,046 |
| 90% | 90.0% | 650,174 | 650,364 |
| 80% | 80.2% | 577,932 | 579,108 |
| 70% | 70.1% | 505,691 | 506,382 |
| 60% | 60.2% | 433,449 | 434,642 |
| 50% | 49.8% | 361,208 | 359,995 |
| 40% | 40.2% | 288,966 | 290,279 |
| 30% | 30.0% | 216,725 | 216,874 |
| 20% | 19.9% | 144,483 | 143,903 |
| 10% | 10.0% | 72,242 | 72,541 |
| Active Idle | 0 | 0 | |

| Target Load | Actual Load | ssj_ops | |
|---|---|---|---|
| Target | Actual | ||
| Calibration 1 | 727,638 | ||
| Calibration 2 | 732,819 | ||
| Calibration 3 | 731,411 | ||
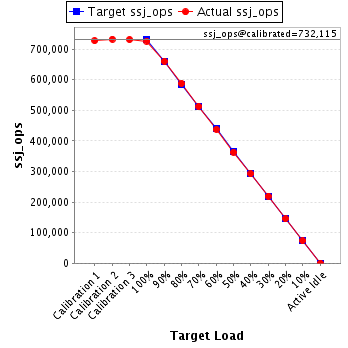
| ssj_ops@calibrated=732,115 | |||
| 100% | 99.2% | 732,115 | 726,290 |
| 90% | 90.2% | 658,904 | 660,729 |
| 80% | 80.3% | 585,692 | 588,216 |
| 70% | 70.0% | 512,481 | 512,827 |
| 60% | 59.8% | 439,269 | 437,845 |
| 50% | 49.7% | 366,058 | 363,585 |
| 40% | 39.9% | 292,846 | 292,156 |
| 30% | 30.0% | 219,635 | 219,641 |
| 20% | 19.8% | 146,423 | 145,278 |
| 10% | 10.1% | 73,212 | 73,608 |
| Active Idle | 0 | 0 | |
| Target Load | Actual Load | ssj_ops | |
|---|---|---|---|
| Target | Actual | ||
| Calibration 1 | 719,653 | ||
| Calibration 2 | 721,308 | ||
| Calibration 3 | 722,409 | ||
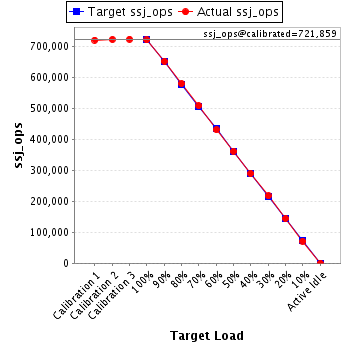
| ssj_ops@calibrated=721,859 | |||
| 100% | 99.7% | 721,859 | 719,832 |
| 90% | 90.2% | 649,673 | 651,372 |
| 80% | 80.2% | 577,487 | 579,267 |
| 70% | 70.3% | 505,301 | 507,776 |
| 60% | 59.6% | 433,115 | 430,378 |
| 50% | 50.1% | 360,929 | 361,643 |
| 40% | 40.1% | 288,744 | 289,364 |
| 30% | 30.1% | 216,558 | 217,000 |
| 20% | 20.0% | 144,372 | 144,366 |
| 10% | 9.9% | 72,186 | 71,406 |
| Active Idle | 0 | 0 | |
| Target Load | Actual Load | ssj_ops | |
|---|---|---|---|
| Target | Actual | ||
| Calibration 1 | 723,713 | ||
| Calibration 2 | 726,674 | ||
| Calibration 3 | 725,585 | ||
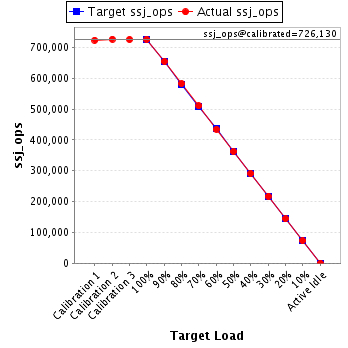
| ssj_ops@calibrated=726,130 | |||
| 100% | 100.0% | 726,130 | 725,877 |
| 90% | 90.2% | 653,517 | 654,755 |
| 80% | 80.2% | 580,904 | 582,587 |
| 70% | 70.3% | 508,291 | 510,168 |
| 60% | 59.8% | 435,678 | 434,406 |
| 50% | 49.9% | 363,065 | 362,664 |
| 40% | 40.1% | 290,452 | 291,006 |
| 30% | 29.9% | 217,839 | 217,304 |
| 20% | 19.8% | 145,226 | 144,118 |
| 10% | 10.1% | 72,613 | 73,342 |
| Active Idle | 0 | 0 | |