SPECpower_ssj2008
Host 'M915-2' Performance Report
Copyright © 2007-2011 Standard Performance Evaluation Corporation
| Dell Inc. PowerEdge M915 | ssj_ops@100% = 1,856,497 ssj_ops@100% per JVM = 232,062 |
||||
| Test Sponsor: | Dell Inc. | SPEC License #: | 55 | Test Method: | Multi Node |
| Tested By: | Dell Inc. | Test Location: | Round Rock, TX, USA | Test Date: | Jun 28, 2011 |
| Hardware Availability: | Jun-2011 | Software Availability: | Feb-2011 | Publication: | Aug 2, 2011 |
| System Source: | Single Supplier | System Designation: | Server | Power Provisioning: | Line-powered |
| Target Load | Actual Load | ssj_ops | |
|---|---|---|---|
| Target | Actual | ||
| Calibration 1 | 1,867,641 | ||
| Calibration 2 | 1,867,745 | ||
| Calibration 3 | 1,861,539 | ||
| ssj_ops@calibrated=1,864,642 | |||
| 100% | 99.6% | 1,864,642 | 1,856,497 |
| 90% | 90.0% | 1,678,178 | 1,678,460 |
| 80% | 80.0% | 1,491,714 | 1,492,140 |
| 70% | 70.1% | 1,305,250 | 1,307,251 |
| 60% | 59.9% | 1,118,785 | 1,116,517 |
| 50% | 49.9% | 932,321 | 931,360 |
| 40% | 40.0% | 745,857 | 745,938 |
| 30% | 30.0% | 559,393 | 558,831 |
| 20% | 19.9% | 372,928 | 371,954 |
| 10% | 9.9% | 186,464 | 185,331 |
| Active Idle | 0 | 0 | |

| Set Identifier: | sut |
| Set Description: | PowerEdge M915 |
| # of Identical Nodes: | 8 |
| Comment: | None |
| Hardware | |
|---|---|
| Hardware Vendor: | Dell Inc. |
| Model: | PowerEdge M915 |
| Form Factor: | Blade |
| CPU Name: | AMD Opteron 6176 (2.30 GHz) |
| CPU Characteristics: | 12 Core, 2.30 GHz, 12 MB L3 Cache |
| CPU Frequency (MHz): | 2300 |
| CPU(s) Enabled: | 48 cores, 4 chips, 12 cores/chip |
| Hardware Threads: | 48 (1 / core) |
| CPU(s) Orderable: | 2,4 chips |
| Primary Cache: | 64 KB I + 64 KB D on chip per core |
| Secondary Cache: | 512 KB I+D on chip per core |
| Tertiary Cache: | 12 MB I+D on chip per chip, 6MB shared / 6 cores |
| Other Cache: | None |
| Memory Amount (GB): | 32 |
| # and size of DIMM: | 16 x 2048 MB |
| Memory Details: | 2GB 1Rx8 PC3L-10600R ECC RDIMM, Slots A1-A4, B1-B4, C1-C4, D1-D4 populated |
| Power Supply Quantity and Rating (W): | None |
| Power Supply Details: | N/A |
| Disk Drive: | 1 x 50 GB 2.5" SSD P/N X2N7H |
| Disk Controller: | PERC H200 Modular |
| # and type of Network Interface Cards (NICs) Installed: | 2 x onboard dual-port 1 Gigabit Ethernet |
| NICs Enabled in Firmware / OS / Connected: | 2/2/1 |
| Network Speed (Mbit): | 1000 |
| Keyboard: | None |
| Mouse: | None |
| Monitor: | None |
| Optical Drives: | No |
| Other Hardware: | None |
| Software | |
|---|---|
| Power Management: | Balanced Mode in OS (See Notes) |
| Operating System (OS): | Windows 2008 Server Enterprise x64 Edition |
| OS Version: | R2 SP1 |
| Filesystem: | NTFS |
| JVM Vendor: | IBM Corporation |
| JVM Version: | IBM J9 VM (build 2.4, J2RE 1.6.0 IBM J9 2.4 Windows Server 2008 amd64-64 jvmwa64 60sr5-20090519_35743 (JIT enabled, AOT enabled) |
| JVM Command-line Options: | -Xaggressive -Xcompressedrefs -Xgcpolicy:gencon -Xmn1400m -Xms1875m -Xmx1875m -XlockReservation -Xnoloa -XtlhPrefetch -Xlp |
| JVM Affinity: | start /affinity [3F, FC0, 3F000, FC0000, 3F000000, FC0000000, 3F000000000, FC0000000000] |
| JVM Instances: | 8 |
| JVM Initial Heap (MB): | 1875 |
| JVM Maximum Heap (MB): | 1875 |
| JVM Address Bits: | 64 |
| Boot Firmware Version: | 1.0.3 |
| Management Firmware Version: | iDRAC 3.21 build 48 |
| Workload Version: | SSJ 1.2.6 |
| Director Location: | Controller |
| Other Software: | IBM WebSphere Application Server |
| JVM Instance | ssj_ops@100% |
|---|---|
| M915-2.001 | 235,746 |
| M915-2.002 | 234,788 |
| M915-2.003 | 228,222 |
| M915-2.004 | 235,207 |
| M915-2.005 | 229,324 |
| M915-2.006 | 231,244 |
| M915-2.007 | 230,908 |
| M915-2.008 | 231,058 |
| ssj_ops@100% | 1,856,497 |
| ssj_ops@100% per JVM | 232,062 |

| Target Load | Actual Load | ssj_ops | |
|---|---|---|---|
| Target | Actual | ||
| Calibration 1 | 237,082 | ||
| Calibration 2 | 237,026 | ||
| Calibration 3 | 237,190 | ||
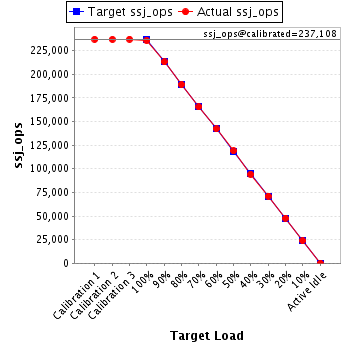
| ssj_ops@calibrated=237,108 | |||
| 100% | 99.4% | 237,108 | 235,746 |
| 90% | 89.8% | 213,397 | 213,028 |
| 80% | 79.8% | 189,687 | 189,135 |
| 70% | 69.8% | 165,976 | 165,418 |
| 60% | 60.0% | 142,265 | 142,226 |
| 50% | 50.1% | 118,554 | 118,855 |
| 40% | 39.7% | 94,843 | 94,157 |
| 30% | 30.0% | 71,132 | 71,161 |
| 20% | 20.2% | 47,422 | 47,843 |
| 10% | 10.1% | 23,711 | 23,858 |
| Active Idle | 0 | 0 | |
| Target Load | Actual Load | ssj_ops | |
|---|---|---|---|
| Target | Actual | ||
| Calibration 1 | 236,464 | ||
| Calibration 2 | 236,067 | ||
| Calibration 3 | 236,267 | ||
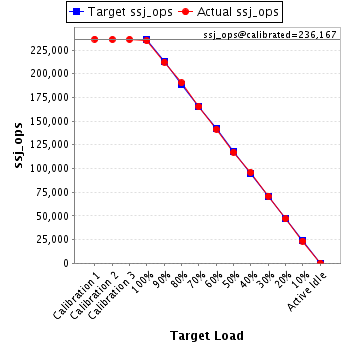
| ssj_ops@calibrated=236,167 | |||
| 100% | 99.4% | 236,167 | 234,788 |
| 90% | 89.9% | 212,550 | 212,327 |
| 80% | 80.6% | 188,933 | 190,279 |
| 70% | 70.0% | 165,317 | 165,346 |
| 60% | 59.9% | 141,700 | 141,575 |
| 50% | 49.7% | 118,083 | 117,292 |
| 40% | 40.6% | 94,467 | 95,770 |
| 30% | 30.0% | 70,850 | 70,839 |
| 20% | 19.8% | 47,233 | 46,841 |
| 10% | 9.9% | 23,617 | 23,459 |
| Active Idle | 0 | 0 | |
| Target Load | Actual Load | ssj_ops | |
|---|---|---|---|
| Target | Actual | ||
| Calibration 1 | 229,151 | ||
| Calibration 2 | 229,206 | ||
| Calibration 3 | 229,358 | ||
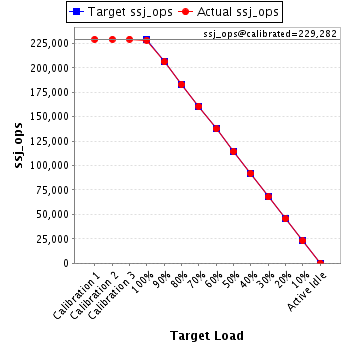
| ssj_ops@calibrated=229,282 | |||
| 100% | 99.5% | 229,282 | 228,222 |
| 90% | 89.9% | 206,354 | 206,057 |
| 80% | 79.8% | 183,426 | 182,929 |
| 70% | 70.0% | 160,498 | 160,566 |
| 60% | 60.0% | 137,569 | 137,498 |
| 50% | 49.8% | 114,641 | 114,242 |
| 40% | 40.1% | 91,713 | 91,865 |
| 30% | 29.6% | 68,785 | 67,837 |
| 20% | 19.8% | 45,856 | 45,383 |
| 10% | 10.0% | 22,928 | 22,883 |
| Active Idle | 0 | 0 | |
| Target Load | Actual Load | ssj_ops | |
|---|---|---|---|
| Target | Actual | ||
| Calibration 1 | 237,153 | ||
| Calibration 2 | 236,888 | ||
| Calibration 3 | 236,391 | ||
| ssj_ops@calibrated=236,639 | |||
| 100% | 99.4% | 236,639 | 235,207 |
| 90% | 90.1% | 212,975 | 213,329 |
| 80% | 80.4% | 189,312 | 190,305 |
| 70% | 70.4% | 165,648 | 166,627 |
| 60% | 59.2% | 141,984 | 140,113 |
| 50% | 50.0% | 118,320 | 118,319 |
| 40% | 40.0% | 94,656 | 94,628 |
| 30% | 30.0% | 70,992 | 70,893 |
| 20% | 20.0% | 47,328 | 47,249 |
| 10% | 9.7% | 23,664 | 23,006 |
| Active Idle | 0 | 0 | |

| Target Load | Actual Load | ssj_ops | |
|---|---|---|---|
| Target | Actual | ||
| Calibration 1 | 230,015 | ||
| Calibration 2 | 230,988 | ||
| Calibration 3 | 230,833 | ||
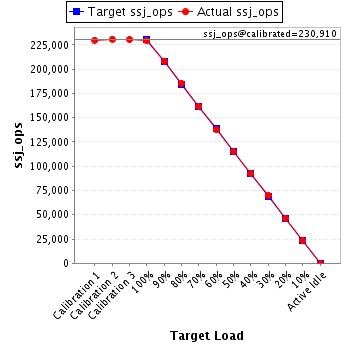
| ssj_ops@calibrated=230,910 | |||
| 100% | 99.3% | 230,910 | 229,324 |
| 90% | 90.2% | 207,819 | 208,351 |
| 80% | 80.3% | 184,728 | 185,402 |
| 70% | 70.0% | 161,637 | 161,645 |
| 60% | 59.6% | 138,546 | 137,564 |
| 50% | 49.8% | 115,455 | 115,072 |
| 40% | 40.0% | 92,364 | 92,273 |
| 30% | 30.3% | 69,273 | 69,941 |
| 20% | 20.0% | 46,182 | 46,275 |
| 10% | 10.0% | 23,091 | 23,113 |
| Active Idle | 0 | 0 | |
| Target Load | Actual Load | ssj_ops | |
|---|---|---|---|
| Target | Actual | ||
| Calibration 1 | 231,371 | ||
| Calibration 2 | 231,989 | ||
| Calibration 3 | 231,710 | ||
| ssj_ops@calibrated=231,850 | |||
| 100% | 99.7% | 231,850 | 231,244 |
| 90% | 89.6% | 208,665 | 207,724 |
| 80% | 79.9% | 185,480 | 185,137 |
| 70% | 70.2% | 162,295 | 162,717 |
| 60% | 60.2% | 139,110 | 139,514 |
| 50% | 49.7% | 115,925 | 115,246 |
| 40% | 40.1% | 92,740 | 92,904 |
| 30% | 30.2% | 69,555 | 69,965 |
| 20% | 20.1% | 46,370 | 46,521 |
| 10% | 9.7% | 23,185 | 22,543 |
| Active Idle | 0 | 0 | |

| Target Load | Actual Load | ssj_ops | |
|---|---|---|---|
| Target | Actual | ||
| Calibration 1 | 233,733 | ||
| Calibration 2 | 234,366 | ||
| Calibration 3 | 228,241 | ||
| ssj_ops@calibrated=231,303 | |||
| 100% | 99.8% | 231,303 | 230,908 |
| 90% | 90.5% | 208,173 | 209,369 |
| 80% | 79.8% | 185,043 | 184,609 |
| 70% | 70.3% | 161,912 | 162,612 |
| 60% | 60.0% | 138,782 | 138,684 |
| 50% | 50.2% | 115,652 | 116,002 |
| 40% | 39.5% | 92,521 | 91,421 |
| 30% | 29.9% | 69,391 | 69,261 |
| 20% | 20.0% | 46,261 | 46,235 |
| 10% | 10.0% | 23,130 | 23,059 |
| Active Idle | 0 | 0 | |

| Target Load | Actual Load | ssj_ops | |
|---|---|---|---|
| Target | Actual | ||
| Calibration 1 | 232,673 | ||
| Calibration 2 | 231,215 | ||
| Calibration 3 | 231,549 | ||
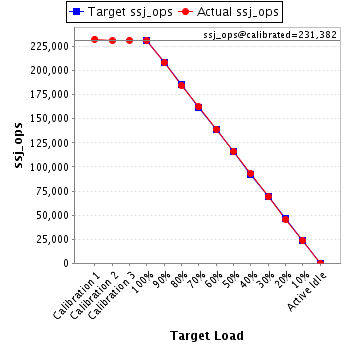
| ssj_ops@calibrated=231,382 | |||
| 100% | 99.9% | 231,382 | 231,058 |
| 90% | 90.0% | 208,244 | 208,273 |
| 80% | 79.7% | 185,106 | 184,344 |
| 70% | 70.2% | 161,968 | 162,319 |
| 60% | 60.2% | 138,829 | 139,343 |
| 50% | 50.3% | 115,691 | 116,333 |
| 40% | 40.2% | 92,553 | 92,920 |
| 30% | 29.8% | 69,415 | 68,935 |
| 20% | 19.7% | 46,276 | 45,606 |
| 10% | 10.1% | 23,138 | 23,409 |
| Active Idle | 0 | 0 | |