
SPECpower_ssj2008
Host 'm915-1' Performance Report
Copyright © 2007-2011 Standard Performance Evaluation Corporation
| Dell Inc. PowerEdge M915 | ssj_ops@100% = 1,839,520 ssj_ops@100% per JVM = 229,940 |
||||
| Test Sponsor: | Dell Inc. | SPEC License #: | 55 | Test Method: | Multi Node |
| Tested By: | Dell Inc. | Test Location: | Round Rock, TX, USA | Test Date: | Jun 28, 2011 |
| Hardware Availability: | Jun-2011 | Software Availability: | Feb-2011 | Publication: | Aug 2, 2011 |
| System Source: | Single Supplier | System Designation: | Server | Power Provisioning: | Line-powered |
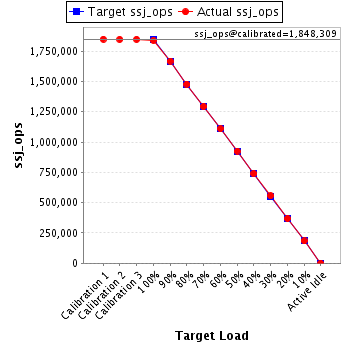
| Target Load | Actual Load | ssj_ops | |
|---|---|---|---|
| Target | Actual | ||
| Calibration 1 | 1,849,488 | ||
| Calibration 2 | 1,847,854 | ||
| Calibration 3 | 1,848,764 | ||
| ssj_ops@calibrated=1,848,309 | |||
| 100% | 99.5% | 1,848,309 | 1,839,520 |
| 90% | 90.3% | 1,663,478 | 1,668,864 |
| 80% | 80.0% | 1,478,647 | 1,477,939 |
| 70% | 70.1% | 1,293,817 | 1,295,139 |
| 60% | 60.0% | 1,108,986 | 1,108,997 |
| 50% | 50.1% | 924,155 | 926,104 |
| 40% | 40.0% | 739,324 | 739,029 |
| 30% | 30.1% | 554,493 | 555,782 |
| 20% | 19.9% | 369,662 | 368,286 |
| 10% | 10.0% | 184,831 | 184,077 |
| Active Idle | 0 | 0 | |
| Set Identifier: | sut |
| Set Description: | PowerEdge M915 |
| # of Identical Nodes: | 8 |
| Comment: | None |
| Hardware | |
|---|---|
| Hardware Vendor: | Dell Inc. |
| Model: | PowerEdge M915 |
| Form Factor: | Blade |
| CPU Name: | AMD Opteron 6176 (2.30 GHz) |
| CPU Characteristics: | 12 Core, 2.30 GHz, 12 MB L3 Cache |
| CPU Frequency (MHz): | 2300 |
| CPU(s) Enabled: | 48 cores, 4 chips, 12 cores/chip |
| Hardware Threads: | 48 (1 / core) |
| CPU(s) Orderable: | 2,4 chips |
| Primary Cache: | 64 KB I + 64 KB D on chip per core |
| Secondary Cache: | 512 KB I+D on chip per core |
| Tertiary Cache: | 12 MB I+D on chip per chip, 6MB shared / 6 cores |
| Other Cache: | None |
| Memory Amount (GB): | 32 |
| # and size of DIMM: | 16 x 2048 MB |
| Memory Details: | 2GB 1Rx8 PC3L-10600R ECC RDIMM, Slots A1-A4, B1-B4, C1-C4, D1-D4 populated |
| Power Supply Quantity and Rating (W): | None |
| Power Supply Details: | N/A |
| Disk Drive: | 1 x 50 GB 2.5" SSD P/N X2N7H |
| Disk Controller: | PERC H200 Modular |
| # and type of Network Interface Cards (NICs) Installed: | 2 x onboard dual-port 1 Gigabit Ethernet |
| NICs Enabled in Firmware / OS / Connected: | 2/2/1 |
| Network Speed (Mbit): | 1000 |
| Keyboard: | None |
| Mouse: | None |
| Monitor: | None |
| Optical Drives: | No |
| Other Hardware: | None |
| Software | |
|---|---|
| Power Management: | Balanced Mode in OS (See Notes) |
| Operating System (OS): | Windows 2008 Server Enterprise x64 Edition |
| OS Version: | R2 SP1 |
| Filesystem: | NTFS |
| JVM Vendor: | IBM Corporation |
| JVM Version: | IBM J9 VM (build 2.4, J2RE 1.6.0 IBM J9 2.4 Windows Server 2008 amd64-64 jvmwa64 60sr5-20090519_35743 (JIT enabled, AOT enabled) |
| JVM Command-line Options: | -Xaggressive -Xcompressedrefs -Xgcpolicy:gencon -Xmn1400m -Xms1875m -Xmx1875m -XlockReservation -Xnoloa -XtlhPrefetch -Xlp |
| JVM Affinity: | start /affinity [3F, FC0, 3F000, FC0000, 3F000000, FC0000000, 3F000000000, FC0000000000] |
| JVM Instances: | 8 |
| JVM Initial Heap (MB): | 1875 |
| JVM Maximum Heap (MB): | 1875 |
| JVM Address Bits: | 64 |
| Boot Firmware Version: | 1.0.3 |
| Management Firmware Version: | iDRAC 3.21 build 48 |
| Workload Version: | SSJ 1.2.6 |
| Director Location: | Controller |
| Other Software: | IBM WebSphere Application Server |
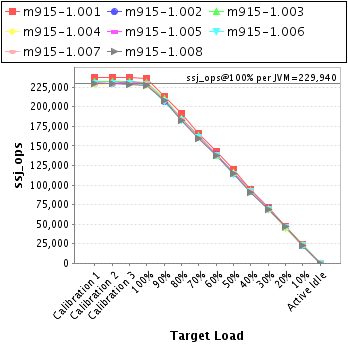
| JVM Instance | ssj_ops@100% |
|---|---|
| m915-1.001 | 235,851 |
| m915-1.002 | 228,986 |
| m915-1.003 | 231,131 |
| m915-1.004 | 227,541 |
| m915-1.005 | 229,810 |
| m915-1.006 | 228,575 |
| m915-1.007 | 230,150 |
| m915-1.008 | 227,477 |
| ssj_ops@100% | 1,839,520 |
| ssj_ops@100% per JVM | 229,940 |
| Target Load | Actual Load | ssj_ops | |
|---|---|---|---|
| Target | Actual | ||
| Calibration 1 | 237,845 | ||
| Calibration 2 | 237,192 | ||
| Calibration 3 | 236,882 | ||
| ssj_ops@calibrated=237,037 | |||
| 100% | 99.5% | 237,037 | 235,851 |
| 90% | 90.1% | 213,333 | 213,494 |
| 80% | 80.5% | 189,630 | 190,887 |
| 70% | 69.9% | 165,926 | 165,624 |
| 60% | 60.0% | 142,222 | 142,232 |
| 50% | 50.6% | 118,519 | 120,055 |
| 40% | 39.8% | 94,815 | 94,358 |
| 30% | 29.9% | 71,111 | 70,924 |
| 20% | 19.8% | 47,407 | 46,877 |
| 10% | 10.0% | 23,704 | 23,720 |
| Active Idle | 0 | 0 | |

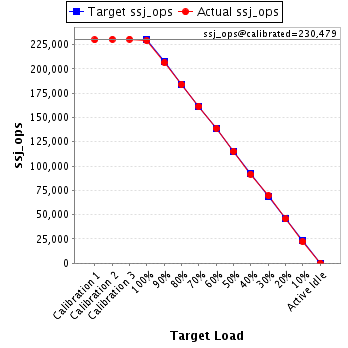
| Target Load | Actual Load | ssj_ops | |
|---|---|---|---|
| Target | Actual | ||
| Calibration 1 | 229,899 | ||
| Calibration 2 | 230,368 | ||
| Calibration 3 | 230,591 | ||
| ssj_ops@calibrated=230,479 | |||
| 100% | 99.4% | 230,479 | 228,986 |
| 90% | 89.6% | 207,432 | 206,483 |
| 80% | 79.8% | 184,384 | 183,933 |
| 70% | 70.0% | 161,336 | 161,421 |
| 60% | 60.2% | 138,288 | 138,864 |
| 50% | 50.0% | 115,240 | 115,157 |
| 40% | 39.7% | 92,192 | 91,543 |
| 30% | 30.1% | 69,144 | 69,438 |
| 20% | 19.8% | 46,096 | 45,599 |
| 10% | 9.7% | 23,048 | 22,275 |
| Active Idle | 0 | 0 | |
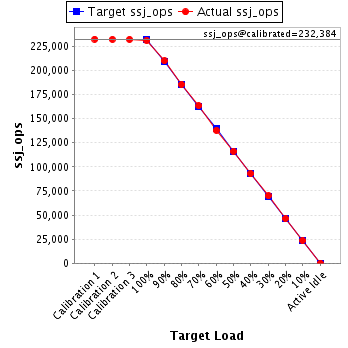
| Target Load | Actual Load | ssj_ops | |
|---|---|---|---|
| Target | Actual | ||
| Calibration 1 | 232,564 | ||
| Calibration 2 | 232,394 | ||
| Calibration 3 | 232,374 | ||
| ssj_ops@calibrated=232,384 | |||
| 100% | 99.5% | 232,384 | 231,131 |
| 90% | 90.4% | 209,146 | 210,003 |
| 80% | 79.8% | 185,907 | 185,522 |
| 70% | 70.4% | 162,669 | 163,543 |
| 60% | 59.3% | 139,430 | 137,878 |
| 50% | 50.1% | 116,192 | 116,406 |
| 40% | 40.0% | 92,954 | 92,950 |
| 30% | 30.1% | 69,715 | 69,917 |
| 20% | 19.9% | 46,477 | 46,346 |
| 10% | 10.2% | 23,238 | 23,667 |
| Active Idle | 0 | 0 | |
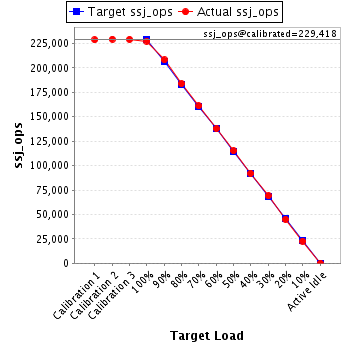
| Target Load | Actual Load | ssj_ops | |
|---|---|---|---|
| Target | Actual | ||
| Calibration 1 | 228,740 | ||
| Calibration 2 | 229,493 | ||
| Calibration 3 | 229,343 | ||
| ssj_ops@calibrated=229,418 | |||
| 100% | 99.2% | 229,418 | 227,541 |
| 90% | 90.8% | 206,476 | 208,320 |
| 80% | 80.1% | 183,534 | 183,845 |
| 70% | 70.2% | 160,592 | 161,069 |
| 60% | 60.1% | 137,651 | 137,867 |
| 50% | 50.2% | 114,709 | 115,063 |
| 40% | 40.1% | 91,767 | 92,050 |
| 30% | 30.1% | 68,825 | 69,028 |
| 20% | 19.6% | 45,884 | 44,913 |
| 10% | 9.9% | 22,942 | 22,726 |
| Active Idle | 0 | 0 | |
| Target Load | Actual Load | ssj_ops | |
|---|---|---|---|
| Target | Actual | ||
| Calibration 1 | 230,833 | ||
| Calibration 2 | 230,417 | ||
| Calibration 3 | 231,857 | ||
| ssj_ops@calibrated=231,137 | |||
| 100% | 99.4% | 231,137 | 229,810 |
| 90% | 90.0% | 208,024 | 208,098 |
| 80% | 80.0% | 184,910 | 184,954 |
| 70% | 70.4% | 161,796 | 162,674 |
| 60% | 60.1% | 138,682 | 138,884 |
| 50% | 49.9% | 115,569 | 115,383 |
| 40% | 40.3% | 92,455 | 93,188 |
| 30% | 30.1% | 69,341 | 69,539 |
| 20% | 19.8% | 46,227 | 45,775 |
| 10% | 10.0% | 23,114 | 23,088 |
| Active Idle | 0 | 0 | |

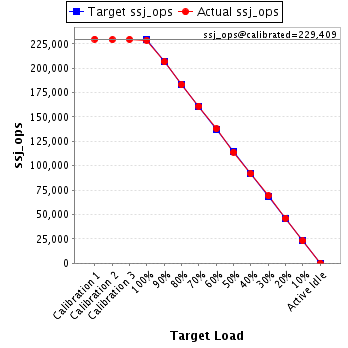
| Target Load | Actual Load | ssj_ops | |
|---|---|---|---|
| Target | Actual | ||
| Calibration 1 | 229,808 | ||
| Calibration 2 | 229,160 | ||
| Calibration 3 | 229,658 | ||
| ssj_ops@calibrated=229,409 | |||
| 100% | 99.6% | 229,409 | 228,575 |
| 90% | 90.1% | 206,468 | 206,598 |
| 80% | 79.8% | 183,527 | 183,017 |
| 70% | 70.2% | 160,587 | 161,098 |
| 60% | 60.1% | 137,646 | 137,976 |
| 50% | 49.7% | 114,705 | 114,000 |
| 40% | 39.9% | 91,764 | 91,615 |
| 30% | 30.1% | 68,823 | 69,109 |
| 20% | 20.2% | 45,882 | 46,276 |
| 10% | 10.0% | 22,941 | 22,898 |
| Active Idle | 0 | 0 | |
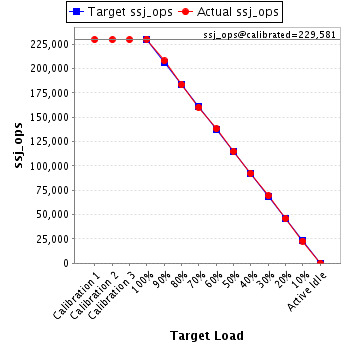
| Target Load | Actual Load | ssj_ops | |
|---|---|---|---|
| Target | Actual | ||
| Calibration 1 | 229,688 | ||
| Calibration 2 | 229,567 | ||
| Calibration 3 | 229,595 | ||
| ssj_ops@calibrated=229,581 | |||
| 100% | 100.2% | 229,581 | 230,150 |
| 90% | 90.6% | 206,623 | 207,897 |
| 80% | 79.8% | 183,665 | 183,149 |
| 70% | 69.8% | 160,707 | 160,290 |
| 60% | 60.1% | 137,749 | 138,092 |
| 50% | 50.1% | 114,791 | 115,017 |
| 40% | 40.2% | 91,832 | 92,269 |
| 30% | 30.2% | 68,874 | 69,223 |
| 20% | 20.1% | 45,916 | 46,032 |
| 10% | 10.0% | 22,958 | 22,852 |
| Active Idle | 0 | 0 | |
| Target Load | Actual Load | ssj_ops | |
|---|---|---|---|
| Target | Actual | ||
| Calibration 1 | 230,110 | ||
| Calibration 2 | 229,263 | ||
| Calibration 3 | 228,464 | ||
| ssj_ops@calibrated=228,863 | |||
| 100% | 99.4% | 228,863 | 227,477 |
| 90% | 90.9% | 205,977 | 207,971 |
| 80% | 79.8% | 183,091 | 182,632 |
| 70% | 69.7% | 160,204 | 159,420 |
| 60% | 60.0% | 137,318 | 137,204 |
| 50% | 50.3% | 114,432 | 115,023 |
| 40% | 39.8% | 91,545 | 91,056 |
| 30% | 30.0% | 68,659 | 68,606 |
| 20% | 20.3% | 45,773 | 46,467 |
| 10% | 10.0% | 22,886 | 22,852 |
| Active Idle | 0 | 0 | |
