SPECpower_ssj2008
Host 'm915-3' Performance Report
Copyright © 2007-2011 Standard Performance Evaluation Corporation
| Dell Inc. PowerEdge M915 | ssj_ops@100% = 1,853,344 ssj_ops@100% per JVM = 231,668 |
||||
| Test Sponsor: | Dell Inc. | SPEC License #: | 55 | Test Method: | Multi Node |
| Tested By: | Dell Inc. | Test Location: | Round Rock, TX, USA | Test Date: | Jun 28, 2011 |
| Hardware Availability: | Jun-2011 | Software Availability: | Feb-2011 | Publication: | Aug 2, 2011 |
| System Source: | Single Supplier | System Designation: | Server | Power Provisioning: | Line-powered |
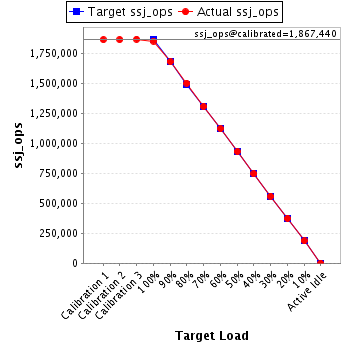
| Target Load | Actual Load | ssj_ops | |
|---|---|---|---|
| Target | Actual | ||
| Calibration 1 | 1,864,577 | ||
| Calibration 2 | 1,865,737 | ||
| Calibration 3 | 1,869,143 | ||
| ssj_ops@calibrated=1,867,440 | |||
| 100% | 99.2% | 1,867,440 | 1,853,344 |
| 90% | 90.0% | 1,680,696 | 1,680,629 |
| 80% | 80.5% | 1,493,952 | 1,502,659 |
| 70% | 70.1% | 1,307,208 | 1,308,633 |
| 60% | 60.1% | 1,120,464 | 1,122,263 |
| 50% | 49.9% | 933,720 | 931,709 |
| 40% | 39.9% | 746,976 | 745,077 |
| 30% | 30.0% | 560,232 | 559,464 |
| 20% | 20.1% | 373,488 | 374,435 |
| 10% | 10.0% | 186,744 | 186,694 |
| Active Idle | 0 | 0 | |
| Set Identifier: | sut |
| Set Description: | PowerEdge M915 |
| # of Identical Nodes: | 8 |
| Comment: | None |
| Hardware | |
|---|---|
| Hardware Vendor: | Dell Inc. |
| Model: | PowerEdge M915 |
| Form Factor: | Blade |
| CPU Name: | AMD Opteron 6176 (2.30 GHz) |
| CPU Characteristics: | 12 Core, 2.30 GHz, 12 MB L3 Cache |
| CPU Frequency (MHz): | 2300 |
| CPU(s) Enabled: | 48 cores, 4 chips, 12 cores/chip |
| Hardware Threads: | 48 (1 / core) |
| CPU(s) Orderable: | 2,4 chips |
| Primary Cache: | 64 KB I + 64 KB D on chip per core |
| Secondary Cache: | 512 KB I+D on chip per core |
| Tertiary Cache: | 12 MB I+D on chip per chip, 6MB shared / 6 cores |
| Other Cache: | None |
| Memory Amount (GB): | 32 |
| # and size of DIMM: | 16 x 2048 MB |
| Memory Details: | 2GB 1Rx8 PC3L-10600R ECC RDIMM, Slots A1-A4, B1-B4, C1-C4, D1-D4 populated |
| Power Supply Quantity and Rating (W): | None |
| Power Supply Details: | N/A |
| Disk Drive: | 1 x 50 GB 2.5" SSD P/N X2N7H |
| Disk Controller: | PERC H200 Modular |
| # and type of Network Interface Cards (NICs) Installed: | 2 x onboard dual-port 1 Gigabit Ethernet |
| NICs Enabled in Firmware / OS / Connected: | 2/2/1 |
| Network Speed (Mbit): | 1000 |
| Keyboard: | None |
| Mouse: | None |
| Monitor: | None |
| Optical Drives: | No |
| Other Hardware: | None |
| Software | |
|---|---|
| Power Management: | Balanced Mode in OS (See Notes) |
| Operating System (OS): | Windows 2008 Server Enterprise x64 Edition |
| OS Version: | R2 SP1 |
| Filesystem: | NTFS |
| JVM Vendor: | IBM Corporation |
| JVM Version: | IBM J9 VM (build 2.4, J2RE 1.6.0 IBM J9 2.4 Windows Server 2008 amd64-64 jvmwa64 60sr5-20090519_35743 (JIT enabled, AOT enabled) |
| JVM Command-line Options: | -Xaggressive -Xcompressedrefs -Xgcpolicy:gencon -Xmn1400m -Xms1875m -Xmx1875m -XlockReservation -Xnoloa -XtlhPrefetch -Xlp |
| JVM Affinity: | start /affinity [3F, FC0, 3F000, FC0000, 3F000000, FC0000000, 3F000000000, FC0000000000] |
| JVM Instances: | 8 |
| JVM Initial Heap (MB): | 1875 |
| JVM Maximum Heap (MB): | 1875 |
| JVM Address Bits: | 64 |
| Boot Firmware Version: | 1.0.3 |
| Management Firmware Version: | iDRAC 3.21 build 48 |
| Workload Version: | SSJ 1.2.6 |
| Director Location: | Controller |
| Other Software: | IBM WebSphere Application Server |
| JVM Instance | ssj_ops@100% |
|---|---|
| m915-3.001 | 233,898 |
| m915-3.002 | 230,810 |
| m915-3.003 | 237,716 |
| m915-3.004 | 233,107 |
| m915-3.005 | 233,125 |
| m915-3.006 | 231,239 |
| m915-3.007 | 229,448 |
| m915-3.008 | 224,000 |
| ssj_ops@100% | 1,853,344 |
| ssj_ops@100% per JVM | 231,668 |

| Target Load | Actual Load | ssj_ops | |
|---|---|---|---|
| Target | Actual | ||
| Calibration 1 | 235,421 | ||
| Calibration 2 | 235,076 | ||
| Calibration 3 | 235,732 | ||
| ssj_ops@calibrated=235,404 | |||
| 100% | 99.4% | 235,404 | 233,898 |
| 90% | 89.5% | 211,864 | 210,605 |
| 80% | 80.4% | 188,323 | 189,238 |
| 70% | 70.5% | 164,783 | 165,906 |
| 60% | 59.9% | 141,242 | 140,975 |
| 50% | 49.7% | 117,702 | 116,992 |
| 40% | 40.4% | 94,162 | 95,153 |
| 30% | 29.9% | 70,621 | 70,469 |
| 20% | 20.2% | 47,081 | 47,549 |
| 10% | 9.9% | 23,540 | 23,279 |
| Active Idle | 0 | 0 | |

| Target Load | Actual Load | ssj_ops | |
|---|---|---|---|
| Target | Actual | ||
| Calibration 1 | 232,066 | ||
| Calibration 2 | 232,185 | ||
| Calibration 3 | 232,423 | ||
| ssj_ops@calibrated=232,304 | |||
| 100% | 99.4% | 232,304 | 230,810 |
| 90% | 90.1% | 209,074 | 209,335 |
| 80% | 80.6% | 185,843 | 187,224 |
| 70% | 70.0% | 162,613 | 162,541 |
| 60% | 59.9% | 139,383 | 139,058 |
| 50% | 49.9% | 116,152 | 116,034 |
| 40% | 39.4% | 92,922 | 91,598 |
| 30% | 30.3% | 69,691 | 70,386 |
| 20% | 20.1% | 46,461 | 46,716 |
| 10% | 10.1% | 23,230 | 23,452 |
| Active Idle | 0 | 0 | |

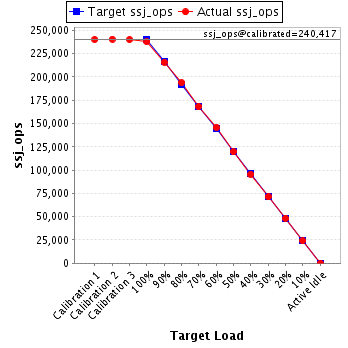
| Target Load | Actual Load | ssj_ops | |
|---|---|---|---|
| Target | Actual | ||
| Calibration 1 | 240,175 | ||
| Calibration 2 | 240,566 | ||
| Calibration 3 | 240,268 | ||
| ssj_ops@calibrated=240,417 | |||
| 100% | 98.9% | 240,417 | 237,716 |
| 90% | 89.8% | 216,375 | 215,928 |
| 80% | 80.6% | 192,333 | 193,674 |
| 70% | 69.9% | 168,292 | 168,130 |
| 60% | 60.6% | 144,250 | 145,677 |
| 50% | 49.8% | 120,208 | 119,628 |
| 40% | 39.8% | 96,167 | 95,656 |
| 30% | 29.6% | 72,125 | 71,222 |
| 20% | 20.2% | 48,083 | 48,514 |
| 10% | 10.0% | 24,042 | 24,061 |
| Active Idle | 0 | 0 | |
| Target Load | Actual Load | ssj_ops | |
|---|---|---|---|
| Target | Actual | ||
| Calibration 1 | 233,391 | ||
| Calibration 2 | 233,509 | ||
| Calibration 3 | 233,604 | ||
| ssj_ops@calibrated=233,557 | |||
| 100% | 99.8% | 233,557 | 233,107 |
| 90% | 90.3% | 210,201 | 210,992 |
| 80% | 80.8% | 186,845 | 188,610 |
| 70% | 70.0% | 163,490 | 163,418 |
| 60% | 59.6% | 140,134 | 139,283 |
| 50% | 49.7% | 116,778 | 116,139 |
| 40% | 39.7% | 93,423 | 92,775 |
| 30% | 30.1% | 70,067 | 70,303 |
| 20% | 20.1% | 46,711 | 46,874 |
| 10% | 9.9% | 23,356 | 23,213 |
| Active Idle | 0 | 0 | |

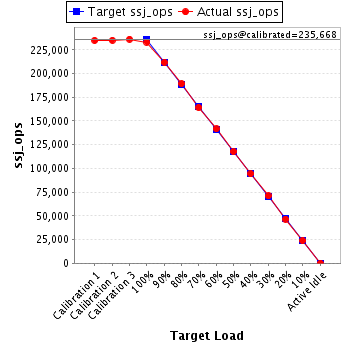
| Target Load | Actual Load | ssj_ops | |
|---|---|---|---|
| Target | Actual | ||
| Calibration 1 | 234,980 | ||
| Calibration 2 | 235,098 | ||
| Calibration 3 | 236,237 | ||
| ssj_ops@calibrated=235,668 | |||
| 100% | 98.9% | 235,668 | 233,125 |
| 90% | 89.9% | 212,101 | 211,924 |
| 80% | 80.3% | 188,534 | 189,270 |
| 70% | 69.7% | 164,967 | 164,201 |
| 60% | 60.1% | 141,401 | 141,683 |
| 50% | 50.0% | 117,834 | 117,851 |
| 40% | 40.0% | 94,267 | 94,172 |
| 30% | 30.1% | 70,700 | 70,944 |
| 20% | 19.8% | 47,134 | 46,657 |
| 10% | 10.1% | 23,567 | 23,884 |
| Active Idle | 0 | 0 | |
| Target Load | Actual Load | ssj_ops | |
|---|---|---|---|
| Target | Actual | ||
| Calibration 1 | 232,730 | ||
| Calibration 2 | 233,282 | ||
| Calibration 3 | 233,288 | ||
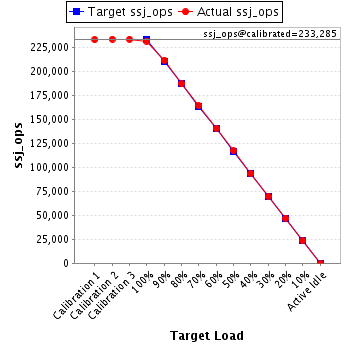
| ssj_ops@calibrated=233,285 | |||
| 100% | 99.1% | 233,285 | 231,239 |
| 90% | 90.6% | 209,957 | 211,282 |
| 80% | 80.1% | 186,628 | 186,905 |
| 70% | 70.3% | 163,300 | 163,997 |
| 60% | 60.2% | 139,971 | 140,508 |
| 50% | 50.2% | 116,643 | 117,078 |
| 40% | 40.0% | 93,314 | 93,339 |
| 30% | 30.0% | 69,986 | 69,924 |
| 20% | 20.1% | 46,657 | 46,934 |
| 10% | 9.9% | 23,329 | 23,185 |
| Active Idle | 0 | 0 | |
| Target Load | Actual Load | ssj_ops | |
|---|---|---|---|
| Target | Actual | ||
| Calibration 1 | 231,004 | ||
| Calibration 2 | 230,414 | ||
| Calibration 3 | 231,133 | ||
| ssj_ops@calibrated=230,774 | |||
| 100% | 99.4% | 230,774 | 229,448 |
| 90% | 89.8% | 207,696 | 207,208 |
| 80% | 80.6% | 184,619 | 186,044 |
| 70% | 70.3% | 161,542 | 162,132 |
| 60% | 60.3% | 138,464 | 139,105 |
| 50% | 49.7% | 115,387 | 114,755 |
| 40% | 40.0% | 92,309 | 92,276 |
| 30% | 29.8% | 69,232 | 68,821 |
| 20% | 19.8% | 46,155 | 45,732 |
| 10% | 10.1% | 23,077 | 23,197 |
| Active Idle | 0 | 0 | |

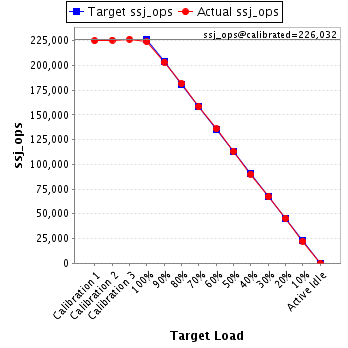
| Target Load | Actual Load | ssj_ops | |
|---|---|---|---|
| Target | Actual | ||
| Calibration 1 | 224,810 | ||
| Calibration 2 | 225,606 | ||
| Calibration 3 | 226,458 | ||
| ssj_ops@calibrated=226,032 | |||
| 100% | 99.1% | 226,032 | 224,000 |
| 90% | 90.0% | 203,429 | 203,356 |
| 80% | 80.4% | 180,826 | 181,696 |
| 70% | 70.0% | 158,223 | 158,307 |
| 60% | 60.2% | 135,619 | 135,974 |
| 50% | 50.1% | 113,016 | 113,234 |
| 40% | 39.9% | 90,413 | 90,108 |
| 30% | 29.8% | 67,810 | 67,396 |
| 20% | 20.1% | 45,206 | 45,459 |
| 10% | 9.9% | 22,603 | 22,424 |
| Active Idle | 0 | 0 | |